You want your investments to pay you — not just someday, but every single quarter. So you discovered dividend ETFs. Then you found two giants that every income investor talks about: SCHD and VYM. Now you’re stuck. Both look great on paper, both cost the same, and every forum gives you a different answer. That uncertainty is costing you time — and time is the one resource you can never buy back. Here’s the good news: a direct, data-driven breakdown of SCHD vs VYM exists, and after reading this, you’ll know exactly which one belongs in your portfolio — or whether you need both.
Key Takeaways:
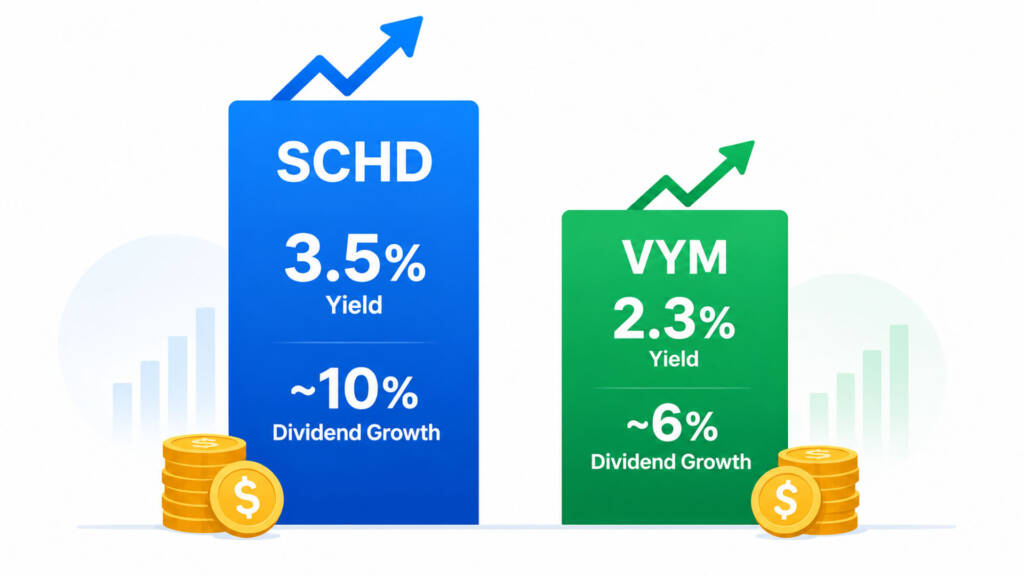
- SCHD (Schwab U.S. Dividend Equity ETF) offers a higher dividend yield of ~3.2–3.5% and stronger long-term dividend growth of ~10–12% per year historically, making it ideal for income-focused investors.
- VYM (Vanguard High Dividend Yield ETF) holds 589+ stocks for broader diversification and has delivered a stronger 5-year total price return thanks to its greater exposure to financials and technology.
- As of May 2026, SCHD is up ~16.72% YTD (with dividends reinvested), meaningfully outpacing both VYM’s +9–10% YTD and a flat-to-negative S&P 500 year-to-date performance.
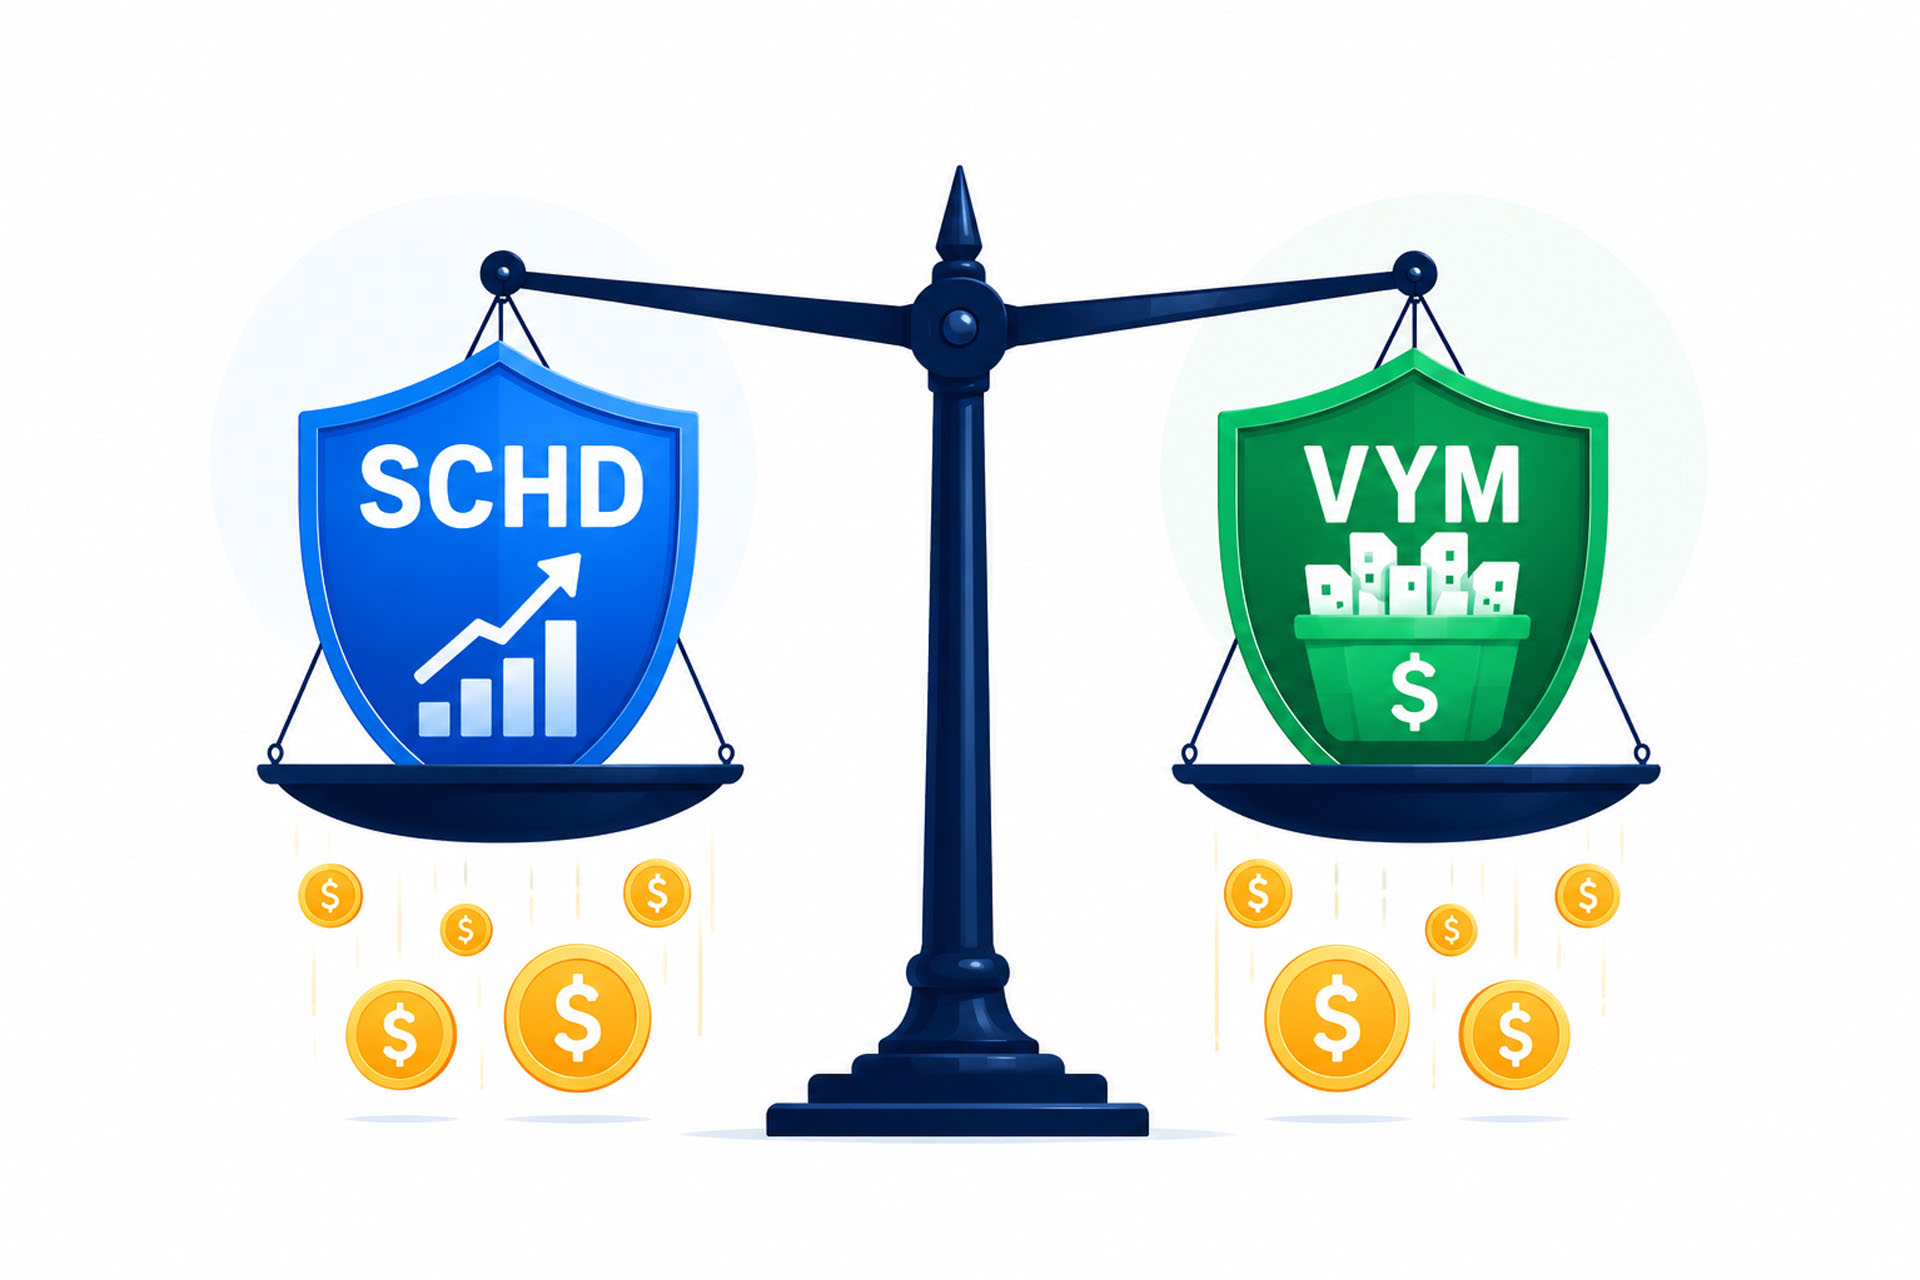
What Are SCHD and VYM?
Before comparing numbers, it helps to understand what each ETF is actually designed to do. They share a category — high-dividend U.S. equity ETFs — but their construction philosophies are fundamentally different.
SCHD is the Schwab U.S. Dividend Equity ETF, launched in October 2011. It tracks the Dow Jones U.S. Dividend 100 Index, selecting only 100 stocks that meet strict quality criteria: at least 10 consecutive years of dividend payments, solid cash flow ratios, return on equity, and dividend growth potential. SCHD is, in essence, a curated list of dividend quality — not just yield.
VYM is the Vanguard High Dividend Yield ETF, launched earlier in November 2006. It tracks the FTSE High Dividend Yield Index, casting a much wider net across 589 stocks selected primarily for above-average dividend yield — with no stringent quality screen. VYM prioritizes breadth and diversification over concentration and quality. Both ETFs are trusted by millions of investors. Both carry an expense ratio of 0.06%, making them equally affordable. To understand the foundational mechanics of how ETFs like these work, check out our guide: What Is ETF Investing?
SCHD vs. VYM: The Head-to-Head Data (May 2026)
Let’s put the numbers side by side. This is the most important table in this article — study it carefully.
| Metric | SCHD (Schwab) | VYM (Vanguard) |
|---|---|---|
| Issuer | Charles Schwab | Vanguard |
| Inception Date | October 2011 | November 2006 |
| Index Tracked | Dow Jones U.S. Dividend 100 | FTSE High Dividend Yield |
| # of Holdings | ~100 | ~589 |
| Expense Ratio | 0.06% | 0.06% |
| Current Price (May 2026) | ~$31.68 | ~$150.74 |
| Dividend Yield | ~3.2–3.5% | ~2.3–2.4% |
| YTD Return 2026 | +16.72% (w/ dividends) | +9–10% |
| 1-Year Total Return | +24.77% | +23.94% |
| 10-Year Annualized Return | 11.14% | 10.98% |
| Dividend Growth (10-yr avg) | ~10–12%/year | ~6%/year |
| Max Drawdown (5 yr) | –16.86% | –15.83% |
| AUM | ~$91.4 billion | ~$84.6 billion |
| Beta | 0.71–0.74 | 0.76–0.78 |
Data sourced from current pricing as of May 17, 2026. Past performance does not guarantee future results.
Several things jump out immediately. First, SCHD’s dividend yield advantage is significant — roughly 1.1–1.2 percentage points higher than VYM’s, which compounds meaningfully over 20–30 years. Second, despite holding only 100 stocks, SCHD has delivered comparable 10-year annualized returns to VYM (11.14% vs 10.98%), while offering a higher income stream. Third, VYM’s lower beta (market sensitivity) means it tends to be marginally more stable during broad selloffs.
Dividend Yield vs. Dividend Growth: The Critical Distinction
This is the most important concept dividend investors need to understand. Yield today and yield on cost over time are two very different things.
SCHD: The Dividend Growth Engine
SCHD’s average annual dividend growth rate over the past 10 years sits at approximately 10.61% — a figure that compresses beautifully over time through the power of compounding. If you invest today at a 3.5% yield and that dividend grows at 10% annually, your yield on cost after 10 years reaches approximately 9.1% — without adding a single new dollar. That means on a $10,000 initial investment, you’d be collecting ~$910 per year in dividends from an outlay you made a decade ago. This is exactly the mechanism described in the Dividend Snowball Effect — the compounding force that transforms modest investments into powerful income streams.
VYM: The Yield-Now Strategy
VYM starts with a lower yield (~2.3–2.4%) but compensates with broader exposure. Its dividend growth averages closer to ~6% annually — still solid, but roughly half the pace of SCHD’s historical rate. For investors who prioritize immediate, stable income and want the security of holding nearly 600 companies across multiple sectors, VYM’s wider net is genuinely valuable. It’s especially appealing during periods when financials and technology outperform — sectors where VYM holds a 21% and 18% weight respectively.
Sector Exposure: Where Your Money Actually Goes
Sector allocation is often the hidden driver of ETF performance differences. SCHD and VYM tilt toward very different corners of the market.
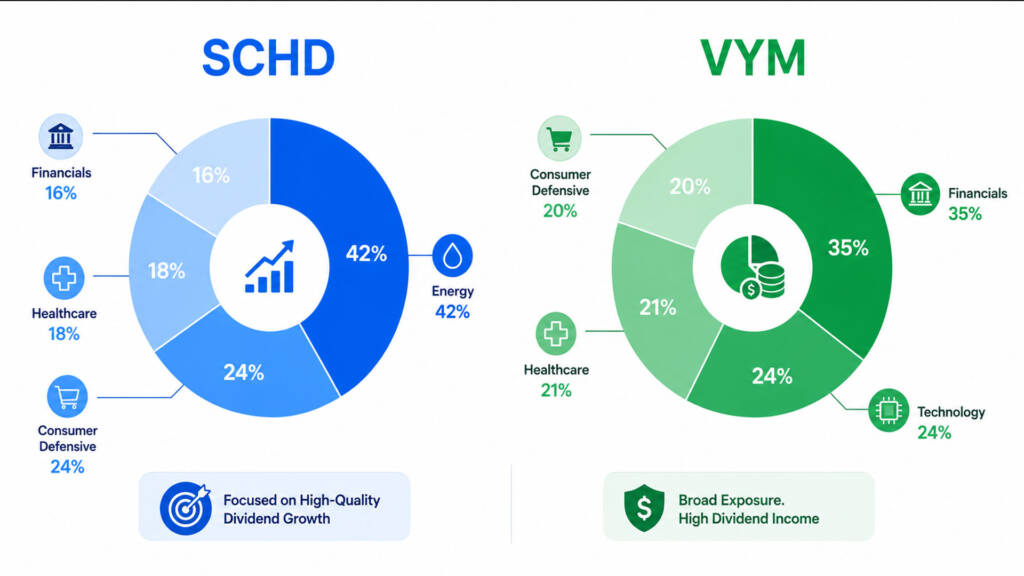
SCHD’s Top Sector Weights:
- Energy — ~19%
- Consumer Defensive — ~18%
- Healthcare — ~18%
- Financials — ~15%
- Industrials — ~11%
VYM’s Top Sector Weights:
- Financial Services — ~21%
- Technology — ~18%
- Healthcare — ~13%
- Industrials — ~10%
- Consumer Defensive — ~9%
This difference matters enormously during different market cycles. In 2025 and early 2026, VYM’s heavier technology allocation helped it outperform on total price return. Meanwhile, during periods of market stress — like early 2026 when the S&P 500 was briefly negative — SCHD’s defensive tilt in energy and consumer staples made it a relative safe haven. By May 2026, SCHD’s YTD return of +16.72% significantly outpaced the broader market.
The Compounding Simulation: $300/Month in SCHD vs. VYM
Let’s make this real with numbers. Assume you invest $300 per month via dollar-cost averaging into each ETF, using their respective 10-year annualized total returns as the projection baseline.
| Years | SCHD (~11.14%/yr) | VYM (~10.98%/yr) |
|---|---|---|
| 10 years | ~$62,900 | ~$62,200 |
| 20 years | ~$237,500 | ~$231,800 |
| 30 years | ~$760,000 | ~$732,000 |
Projected values based on historical 10-year annualized returns (SCHD: 11.14%, VYM: 10.98%). Past performance does not guarantee future results. Projections are for illustrative purposes only.
The difference widens meaningfully over 30 years — approximately $28,000 more in SCHD’s favor from the same monthly contributions, driven by that small but persistent return advantage. However, these projections exclude the compounding dividend reinvestment advantage that SCHD’s higher yield provides, which could push its lead even further over multi-decade horizons.
To understand how consistent monthly investing turbocharges compounding, read our guide on Dollar-Cost Averaging Explained.
Who Should Choose SCHD?
SCHD is the stronger choice if your goals align with any of the following:
- You want the highest dividend yield today (~3.2–3.5%) while still growing that income over time
- You’re building a dividend snowball strategy focused on long-term income compounding
- You prefer quality-screened, concentrated holdings over broad market exposure
- You’re investing in a tax-advantaged account (IRA/401k) where dividend income doesn’t trigger immediate tax liability
- You want defensive sector exposure during volatile or recessionary markets
SCHD’s $91.4B in AUM and 16M+ daily shares traded give it exceptional liquidity — you’ll never have trouble buying or selling at a fair price.
Who Should Choose VYM?
VYM is the stronger fit if your priorities look like this:
- You want the broadest possible diversification — 589 companies across the full dividend universe
- You’re comfortable with a lower starting yield (~2.3%) in exchange for more tech and financial exposure
- You believe large-cap technology will continue to drive returns in the years ahead
- You want a lower maximum drawdown profile (–15.83% vs SCHD’s –16.86% over 5 years)
- You’re a Vanguard loyalist who prefers Vanguard’s passive, full-replication methodology
VYM’s longer track record (launched 2006 vs. SCHD’s 2011) also gives it a deeper historical dataset through multiple market cycles, including the 2008–2009 financial crisis.
The Smarter Play: Use Both in a Core + Income Portfolio
Here’s a perspective most comparison articles miss: you don’t have to choose. In fact, many experienced long-term investors hold both SCHD and VYM as complementary income layers within a broader portfolio structure.
A practical allocation framework might look like this:
- Core (50–60%): VOO (Vanguard S&P 500 ETF) — your primary growth and compounding engine
- Dividend Growth Layer (15–20%): SCHD — for growing income and quality dividend exposure
- High-Yield Breadth Layer (10–15%): VYM — for diversification and broader dividend capture
- Income Boost (5–10%): JEPQ — for enhanced monthly covered-call income
This structure gives you market-rate growth from VOO’s broad exposure, a rising income stream from SCHD’s quality dividend compounding, diversification from VYM’s 589 holdings, and enhanced monthly cash flow from an options-income layer. For a real-world example of this kind of layered portfolio, see our article on the VOO and JEPQ Portfolio Strategy. And to understand the philosophical tension between growth-focused and income-focused investing that informs this structure, our article on Growth vs. Dividend Investing is an essential read.
Remember: no matter which dividend ETF you choose, your strategy lives or dies on consistency. Reinvesting dividends, contributing regularly, and resisting the urge to sell during downturns are the real drivers of long-term wealth — not perfect ETF selection.
For further research on these ETFs directly from the issuers, Vanguard’s official VYM profile at investor.vanguard.com and Schwab’s ETF center offer complete prospectus-level data. Investopedia’s ETF comparison tools are also excellent for independent verification.
Conclusion & Call to Action
The SCHD vs VYM debate doesn’t have a single loser — it has two excellent tools designed for slightly different jobs. If you want higher income today and faster dividend growth over time, SCHD is your vehicle. If you want broader diversification and slightly more tech-driven total return, VYM earns its place. And if you want the most powerful long-term wealth engine available to a retail investor, pair either one — or both — as a satellite layer around a core position in VOO.
The market has already given us the data. Your job now is to act on it consistently.
Which dividend ETF are you holding in 2026 — SCHD, VYM, or both? Tell us your strategy in the comments below. And if you’re still building your foundational knowledge, don’t miss our full breakdown of Stocks vs. ETFs for Long-Term Wealth to see how dividend ETFs fit into the bigger picture.
Frequently Asked Questions
Q1: Is SCHD better than VYM for long-term passive income investing?
A1: For pure income compounding, SCHD has a strong edge. Its dividend yield of ~3.2–3.5% is significantly higher than VYM’s ~2.3%, and its historical dividend growth rate of ~10–12% annually means your income nearly doubles every 7 years through the compounding effect. However, VYM’s broader diversification and stronger short-term total returns in recent years make it a legitimate alternative for investors who want less concentrated exposure. The best choice depends on whether you prioritize yield today or breadth of holdings.
Q2: Can SCHD and VYM both be held together in the same portfolio?
A2: Absolutely — and many experienced investors do exactly that. SCHD’s 100 quality-screened stocks and VYM’s 589 broader holdings have limited overlap, meaning they genuinely complement each other. SCHD anchors the income-quality layer, while VYM adds diversified exposure to sectors like financials and technology that SCHD underweights. Holding both within a larger portfolio that includes VOO as the core gives you growth, quality income, and diversification all at once.
Q3: How does SCHD perform during a market downturn compared to VYM?
A3: Both ETFs are relatively defensive compared to the broad S&P 500, thanks to their dividend-focused stock selection. VYM has a marginally lower maximum 5-year drawdown (–15.83% vs SCHD’s –16.86%), suggesting it holds up slightly better during sharp selloffs. However, SCHD’s heavy weighting in energy and consumer defensive sectors provides its own form of protection. In early 2026, when the S&P 500 briefly fell into negative territory, SCHD’s year-to-date return of +16.72% (through May 13) showed that its defensive tilt can meaningfully outperform during risk-off environments.
Financial Disclaimer: This article is intended for educational and informational purposes only. The data, comparisons, and compounding simulations presented here are based on historical performance and publicly available information as of May 2026. Nothing in this article constitutes personalized financial advice, a recommendation to buy or sell any security, or a guarantee of future returns. All investments carry risk, including the possible loss of principal. Dividend payments are not guaranteed and may be reduced or eliminated. Always conduct your own due diligence and consult with a licensed financial advisor or registered investment professional before making any investment decisions.