Every income investor eventually asks the same question: “Why can’t I have both — a high monthly yield AND market growth?” The stock market rarely rewards that kind of greed. Traditional dividend ETFs offer 1–3% yields but weak income. High-yield funds often erode your capital. The frustration is real, and it keeps countless investors stuck in low-yield savings accounts while inflation quietly eats their purchasing power. Enter JEPQ — the JPMorgan Nasdaq Equity Premium Income ETF. In this JEPQ ETF review 2026, we break down exactly how this fund works, what its current ~10% yield really means, and whether it deserves a place in your portfolio — or whether it’s too good to be true.
Key Takeaways:
- JEPQ currently offers a ~10.1% trailing yield and has delivered 44+ consecutive monthly distributions since its May 2022 inception — making it one of the most consistent income ETFs in the market.
- JEPQ uses a covered call strategy on Nasdaq-100 stocks to generate its extraordinary income — but this structure caps upside in strong bull markets, meaning it will typically underperform QQQ during major tech rallies.
- JEPQ works best as a satellite holding (10–20% of your portfolio), paired with a broad-market core like VOO — not as a standalone long-term growth vehicle.
What Is the JEPQ ETF? Core Overview
JEPQ — formally the JPMorgan Nasdaq Equity Premium Income ETF — is an actively managed ETF launched by J.P. Morgan Asset Management on May 3, 2022. Its stated investment objective is to “seek current income while maintaining prospects for capital appreciation.”
As of June 2026, JEPQ is one of the largest income-focused ETFs in the U.S. market, with approximately $39–$40 billion in assets under management (AUM). It trades under the ticker JEPQ on the Nasdaq and currently trades at approximately $59–$60 per share.
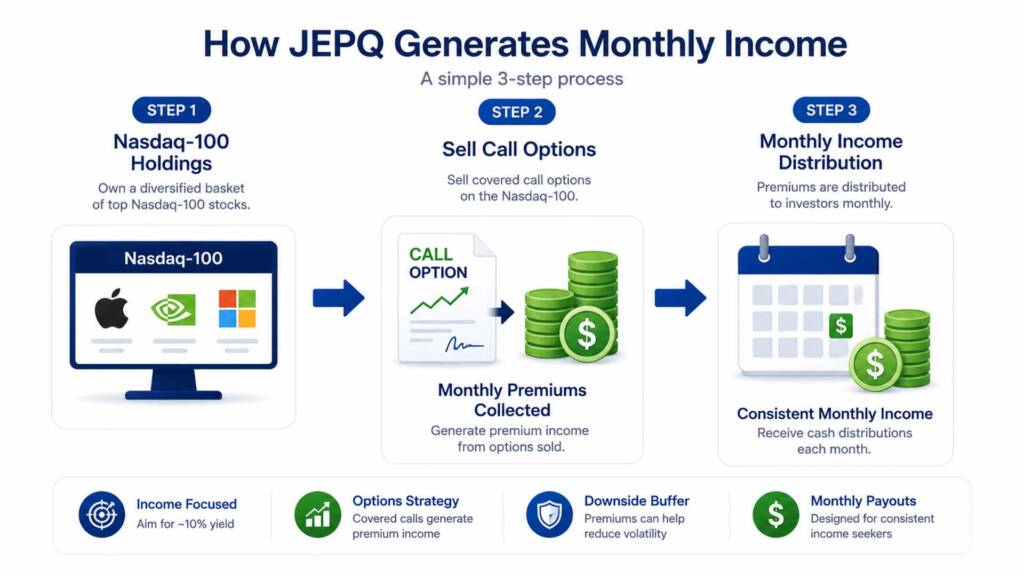
JEPQ achieves its income objective by combining two strategies:
- Owning Nasdaq-100 stocks — including mega-cap tech giants like NVIDIA (~7.78%), Apple (~6.76%), and Microsoft (~6.25%)
- Systematically selling (writing) out-of-the-money call options on these holdings to collect option premiums, which are then distributed to shareholders as monthly income
This structure — known as an equity premium income or covered call strategy — is the engine behind JEPQ’s high yield. It generates income that traditional index ETFs cannot match. However, as we will explore in detail, it also comes with meaningful trade-offs.
JEPQ Key Facts at a Glance (June 2026)
| Attribute | JEPQ |
|---|---|
| Full Name | JPMorgan Nasdaq Equity Premium Income ETF |
| Issuer | J.P. Morgan Asset Management |
| Inception Date | May 3, 2022 |
| AUM | ~$39–$40 Billion |
| Approximate Price | ~$59–$60 |
| Trailing Dividend Yield | ~10.1% |
| 30-Day SEC Yield | ~12.7% |
| Expense Ratio | 0.35% |
| Distribution Frequency | Monthly |
| Holdings | ~94 stocks |
| Beta (5Y Monthly) | 0.77 |
| YTD Total Return (2026) | ~6.1–9.2% |
| Inception-to-Date Annualized Return | ~17.09% |
| Underlying Index | Nasdaq-100 (actively managed overlay) |
How the Covered Call Strategy Actually Works
Understanding JEPQ requires understanding covered calls — the mechanism behind every dollar of its income.
A call option gives the buyer the right (but not the obligation) to purchase a stock at a specific price (the strike price) before a certain date (expiration). When JEPQ sells a call option on a Nasdaq-100 stock it already owns, it receives an upfront premium payment from the buyer. That premium becomes income — distributed to JEPQ shareholders every month.
The “out-of-the-money” part is important. JEPQ sells calls with strike prices above the current index price. This means the fund still participates in some upside — but only up to the strike price. If Nasdaq rallies beyond that level, JEPQ’s upside is capped and the gains go to the option buyer instead.
Here is a simplified example:
- JEPQ holds Apple stock at $200/share
- JEPQ sells a call option with a strike of $215, collecting a $3 premium
- If Apple stays below $215 at expiration → JEPQ keeps the $3 and repeats the process
- If Apple surges to $230 → JEPQ’s gain is capped at $15 (strike – purchase price), not $30
This trade-off — income today vs. growth tomorrow — is the central tension every JEPQ investor must understand.
JEPQ Performance in 2026: The Real Numbers
Let’s look at what the data actually shows in 2026.
Year-to-Date and 1-Year Returns
As of early June 2026, JEPQ has delivered:
- YTD Total Return: ~6.1–9.2%
- 1-Year Total Return: ~29.71% (with dividends reinvested)
- Inception-to-Date Annualized Return: ~17.09%
For comparison, QQQ (Invesco Nasdaq-100 ETF) has delivered:
This confirms a key structural reality: in a strong bull market, JEPQ underperforms QQQ significantly. QQQ’s 1-year total return of 42.97% vs JEPQ’s 29.71% represents roughly a 13-percentage-point gap — the direct cost of selling upside through options.
However, the picture changes in volatile or sideways markets. During the April 2025 sell-off and the March 2026 pullback, JEPQ’s lower beta (0.77 vs QQQ’s ~1.0+) provided some cushioning — though not complete protection, as both ETFs fell materially during sudden, sharp declines.
Monthly Distribution History (2026)
One of JEPQ’s most compelling features is its unbroken streak of 44+ consecutive monthly payments since inception. Here is the 2026 distribution data:
| Month | Distribution Per Share |
|---|---|
| January 2026 | $0.576 |
| February 2026 | $0.466 |
| March 2026 | $0.509 |
| April 2026 | $0.559 |
| May 2026 | $0.591 |
| June 2026 | $0.564 |
Trailing 12-month distributions total approximately $6.12 per share, confirming a yield of roughly 10.1–10.8% at a price near $59–$60. Note that monthly amounts fluctuate based on market volatility — when the VIX spikes, option premiums rise and JEPQ pays more; when markets are calm, premiums and distributions fall.
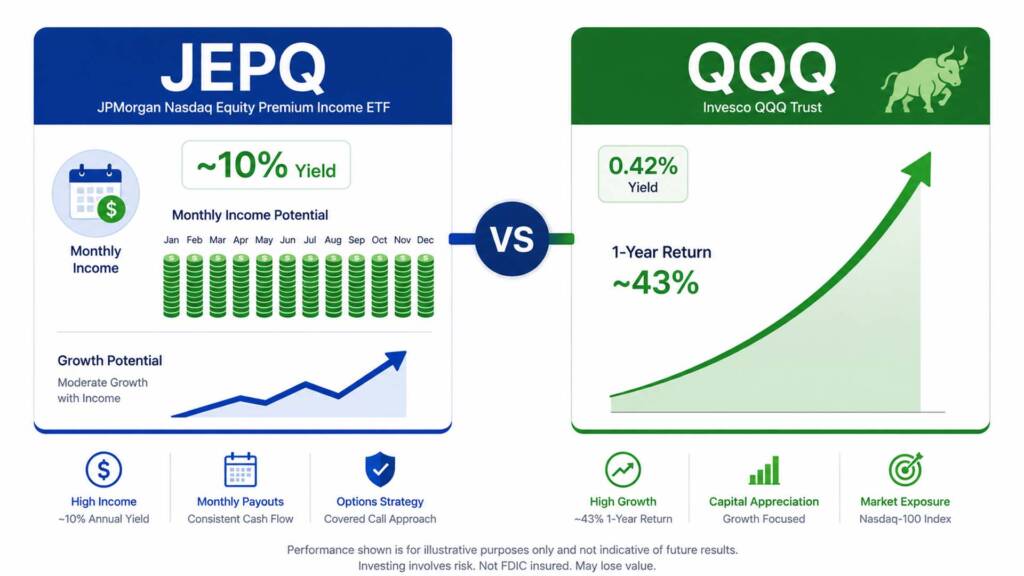
JEPQ vs QQQ: A Direct Comparison
For many investors, the real question is: Should I own JEPQ or just buy QQQ?
| Feature | JEPQ | QQQ |
|---|---|---|
| Strategy | Covered call income | Pure Nasdaq-100 index |
| Expense Ratio | 0.35% | 0.18% |
| Dividend Yield | ~10.1% | ~0.42% |
| YTD Return (2026) | ~9.2% | ~20.3% |
| 1-Year Total Return | ~29.7% | ~43.0% |
| AUM | ~$40B | ~$485B |
| Beta | 0.77 | ~1.0+ |
| Monthly Distributions | ✅ Yes | ❌ No |
| Upside Cap | ✅ Yes (calls) | ❌ No |
| Best For | Current income | Maximum growth |
The answer depends entirely on what you need from your portfolio right now. If you are in the accumulation phase and decades from retirement, QQQ’s superior total return compounding wins over time. If you need monthly cash flow today — for living expenses, semi-retirement, or supplementing income — JEPQ’s 10%+ yield is genuinely competitive.
A $10,000 JEPQ Income Simulation
To make the monthly income concept concrete, here is what a $10,000 investment in JEPQ at the current yield of ~10.1% would generate annually, based on recent distribution data:
| Portfolio Size | Annual Income at ~10.1% Yield | Monthly Income (Average) |
|---|---|---|
| $10,000 | ~$1,010 | ~$84 |
| $25,000 | ~$2,525 | ~$210 |
| $50,000 | ~$5,050 | ~$421 |
| $100,000 | ~$10,100 | ~$842 |
These are illustrative projections based on JEPQ’s trailing 12-month yield as of June 2026 (~10.1%). Monthly distributions fluctuate. This does not account for potential NAV erosion or changes in market volatility. Past performance does not guarantee future results.
This level of income is genuinely compelling — but remember, this yield comes at the cost of capped capital appreciation relative to a pure Nasdaq-100 fund.
JEPQ Pros and Cons: An Honest Assessment
✅ The Case FOR JEPQ
- Extraordinary monthly income. A ~10%+ yield paid monthly is nearly unmatched in the ETF universe. For income-focused investors, this is a genuine cash-flow machine.
- Nasdaq-100 quality exposure. JEPQ’s holdings include the world’s top tech companies — NVIDIA, Apple, Microsoft, Amazon, Meta. It is not a low-quality, junk-bond income play.
- Lower volatility than QQQ. JEPQ’s beta of 0.77 means it typically falls less sharply than the Nasdaq-100 during sell-offs — though this protection is imperfect in sudden crashes.
- Proven consistency. 44+ consecutive monthly payments since May 2022 demonstrates remarkable income reliability through multiple market cycles.
- Solid AUM base. With ~$40 billion in assets, JEPQ has the scale and liquidity of a mature, institutional-grade ETF.
- Strong since inception. An annualized return of ~17.09% since inception — which includes the 2022 bear market — is a genuinely impressive track record.
⚠️ The Case AGAINST JEPQ
- Capped upside in bull markets. In strong rallies, JEPQ significantly underperforms pure Nasdaq-100 exposure. In 2026 YTD, QQQ returned ~20% vs. JEPQ’s ~9%.
- Higher expense ratio. At 0.35%, JEPQ is 17x more expensive than VOO (0.03%) and nearly 2x QQQ (0.18%).
- Tax inefficiency. JEPQ’s distributions are largely classified as ordinary income, not qualified dividends — meaning they are taxed at your marginal income tax rate, not the preferential 15–20% qualified dividend rate. This makes JEPQ significantly more tax-efficient inside a Roth IRA or 401(k) than in a taxable brokerage account.
- Variable monthly income. Distributions fluctuate with market volatility. They ranged from $0.47 to $0.59 per share in 2026 alone — requiring flexible budgeting.
- Not a traditional dividend fund. The income is generated by selling options — not from underlying company profits. This is a mechanical strategy, not a reflection of fundamental business health.
- Limited long-term track record. At just four years old (inception May 2022), JEPQ has not yet been tested through a full secular bear market or extended period of extremely low volatility.
Tax Considerations for JEPQ Investors
Tax treatment is one of the most important — and most overlooked — factors when evaluating covered call ETFs like JEPQ.
JEPQ’s distributions typically fall into three tax categories:
- Ordinary income dividends — taxed at your regular marginal income tax rate (up to 37% for high earners)
- Capital gain distributions — taxed at the capital gains rate
- Return of capital (ROC) — defers tax by reducing your cost basis; may be taxed as capital gains when you sell
The practical implication: holding JEPQ in a tax-advantaged account (Roth IRA or Traditional IRA/401k) dramatically improves your after-tax return. In a Roth IRA, JEPQ’s ~10% monthly income grows completely tax-free. For investors in Singapore or other jurisdictions with no capital gains tax, any NAV appreciation is fully tax-free — making JEPQ structurally advantageous for international investors. Always consult a qualified tax professional for your specific situation.
Who Should Own JEPQ — And How to Use It
JEPQ is not a one-size-fits-all ETF. Here is a clear framework for who it suits best:
JEPQ is a strong fit if:
- You need monthly cash flow today (retirees, semi-retirees, income supplementers)
- You hold it inside a Roth IRA or tax-advantaged account to shelter ordinary income distributions
- You are using it as a satellite holding (10–20% of your portfolio), not your entire equity position
- You already have a broad-market core like VOO or QQQ providing full growth exposure
- You are comfortable with variable monthly income and do not rely on a fixed monthly amount
JEPQ is a poor fit if:
- You are in the early accumulation phase (20s–40s) prioritizing maximum long-term wealth growth
- You hold it as your primary or sole equity ETF
- You are in a high tax bracket holding it in a taxable brokerage account
- You expect it to perform like a pure Nasdaq-100 growth fund in a bull market
The most effective portfolio structure for most investors is using VOO as the stable core (60–80%) for long-term appreciation, then adding JEPQ as an income satellite (10–20%) for monthly cash flow generation. Our complete guide to building a VOO and JEPQ portfolio walks through exactly how to structure this combination. For broader portfolio architecture, our core-and-satellite portfolio guide is the essential companion read.
If you are comparing JEPQ to its sibling fund, our dedicated JEPI vs JEPQ comparison breaks down how the S&P 500 version (JEPI) differs from JEPQ’s Nasdaq-100 approach — a key decision for income investors.
Conclusion & Call to Action
The JEPQ ETF review 2026 paints a nuanced picture. JEPQ is a genuinely innovative income tool — delivering a ~10.1% yield, paid monthly, backed by world-class Nasdaq-100 tech holdings, and with a four-year track record of unbroken distributions. However, it is not a magic bullet. Its capped upside, higher expense ratio, tax inefficiency in taxable accounts, and structural underperformance during strong bull markets mean it works best as a strategic satellite — not a portfolio cornerstone.
For most long-term investors, the winning formula is clear: anchor your portfolio with a broad-market ETF like VOO for stable growth, then layer in JEPQ for income enhancement. Start investing in JEPQ and VOO with low commissions at Interactive Brokers — one of the best platforms for both U.S. and international investors. For authoritative background on covered call ETF mechanics, Investopedia’s options income ETF guide is an excellent resource.
Does JEPQ belong in your portfolio? Leave a comment below and share how you are using it. And if you are building a full passive income ETF portfolio from scratch, check out our complete passive income ETF portfolio guide to see exactly how to structure your holdings in 2026.
FAQs
Q1: Is JEPQ a good long-term investment for buy-and-hold investors?A1: JEPQ can be a solid long-term income holding, but it is not optimized for maximum wealth accumulation. Its annualized return since inception is approximately 17.09% — respectable — but QQQ has historically outperformed over extended bull markets due to JEPQ’s structurally capped upside. For long-term buy-and-hold investors, JEPQ works best as a 10–20% satellite income allocation alongside a growth-focused core holding like VOO or QQQ. Do not allocate your entire portfolio to JEPQ if long-term capital appreciation is your primary goal.
Q2: How does JEPQ generate its ~10% yield if Nasdaq stocks only pay ~0.4% in dividends?A2: JEPQ generates the majority of its income by selling (writing) out-of-the-money call options on its Nasdaq-100 stock holdings. Option buyers pay JEPQ a premium upfront for the right to buy the underlying stocks at a predetermined strike price. JEPQ collects these premiums each month and distributes them to shareholders. This is entirely separate from the underlying stocks’ own dividends. However, the trade-off is that if the Nasdaq rallies strongly past the strike price, JEPQ’s capital gains are capped — explaining why it underperforms QQQ in strong bull markets.
Q3: Is JEPQ tax-efficient, and should I hold it in a Roth IRA or taxable account?A3: JEPQ is not tax-efficient in a taxable brokerage account. Most of its distributions are classified as ordinary income, meaning they are taxed at your full marginal income tax rate — not at the preferential 15–20% qualified dividend rate. For maximum after-tax returns, JEPQ is best held in a Roth IRA, where distributions and growth are completely tax-free. In a Traditional IRA, taxes are deferred until withdrawal. In a taxable account, especially for investors in higher tax brackets, the tax drag can significantly reduce JEPQ’s net yield advantage. International investors in jurisdictions with no capital gains or dividend withholding taxes — such as Singapore — may have a structural advantage holding JEPQ. Always consult a qualified tax professional for personalized advice.
Financial Disclaimer: This article is intended for educational and informational purposes only. It does not constitute financial, investment, tax, or legal advice. All performance data, yield figures, distribution history, and projections referenced are based on publicly available information as of June 2026. Past performance does not guarantee future results. Investing in ETFs — including covered call ETFs like JEPQ — involves risk, including the potential loss of principal. Monthly distributions are variable and not guaranteed. Individual financial situations, tax circumstances, and risk tolerances differ significantly. Always conduct thorough due diligence and consult a licensed financial advisor or tax professional before making any investment decisions.