You want passive income from your investments — real, monthly cash flow that hits your account regardless of what the market does. However, when you discover that JEPI and JEPQ both yield between 8% and 10%+, a new problem emerges: which one do you actually choose? Picking the wrong one could mean sacrificing years of capital growth, locking into the wrong level of volatility, or misaligning the fund with your personal investment goals. Fortunately, this deep-dive JEPI vs JEPQ comparison will cut through the confusion. You will get every key data point, side-by-side numbers, and a clear framework for making the right decision in 2026.
Key Takeaways:
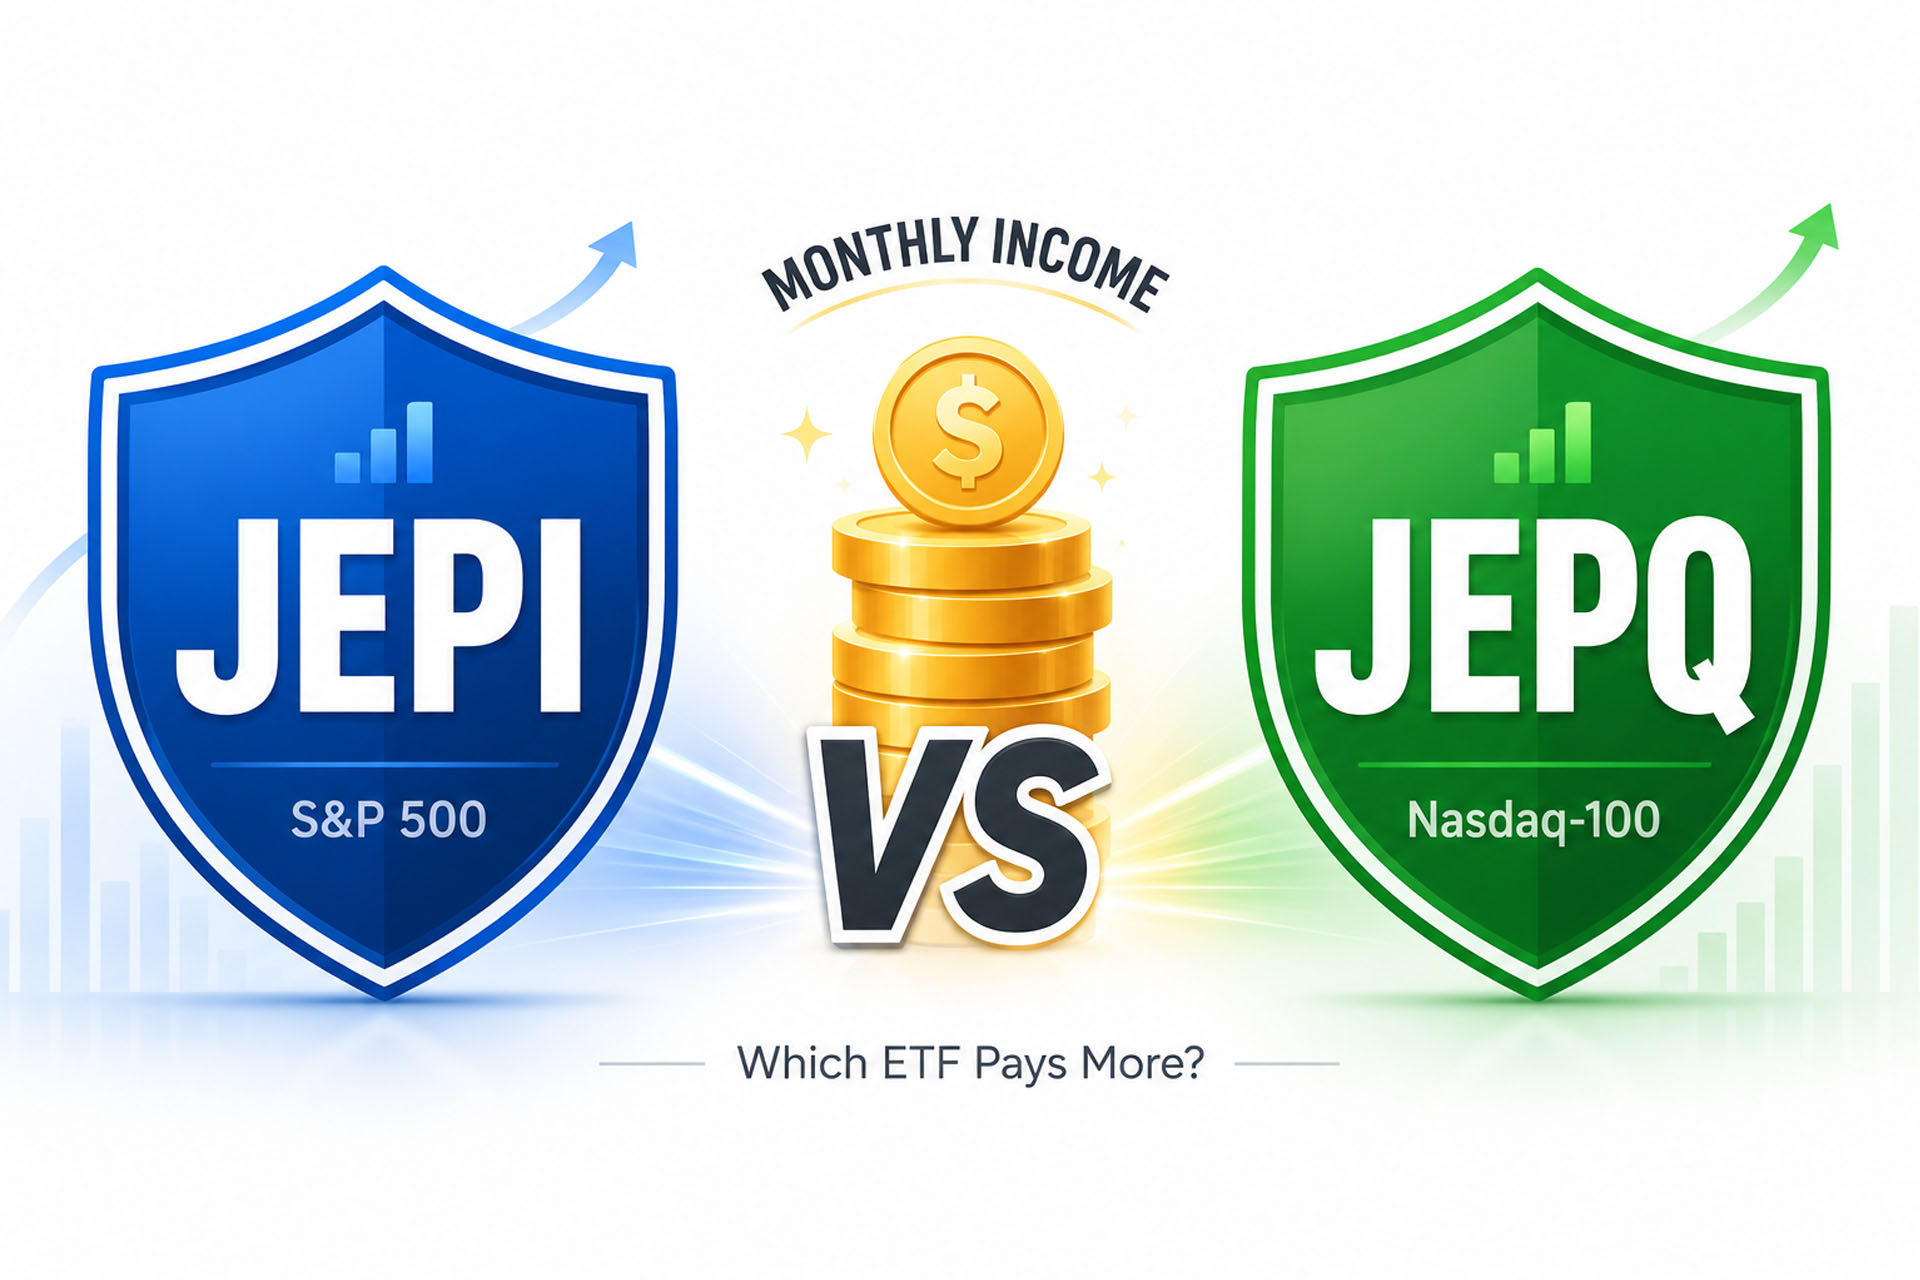
- JEPI yields ~8.36–8.45% and focuses on S&P 500 defensive stocks — lower volatility, steadier income, and reduced upside participation.
- JEPQ yields ~10.11–10.48% and anchors itself to the Nasdaq-100 — higher income potential and greater capital appreciation, but with more volatility and tech concentration risk.
- Both funds charge an identical 0.35% expense ratio and pay monthly distributions — but they serve different investor profiles, and understanding that difference is the key to choosing wisely.
What Are JEPI and JEPQ? Understanding the Strategy
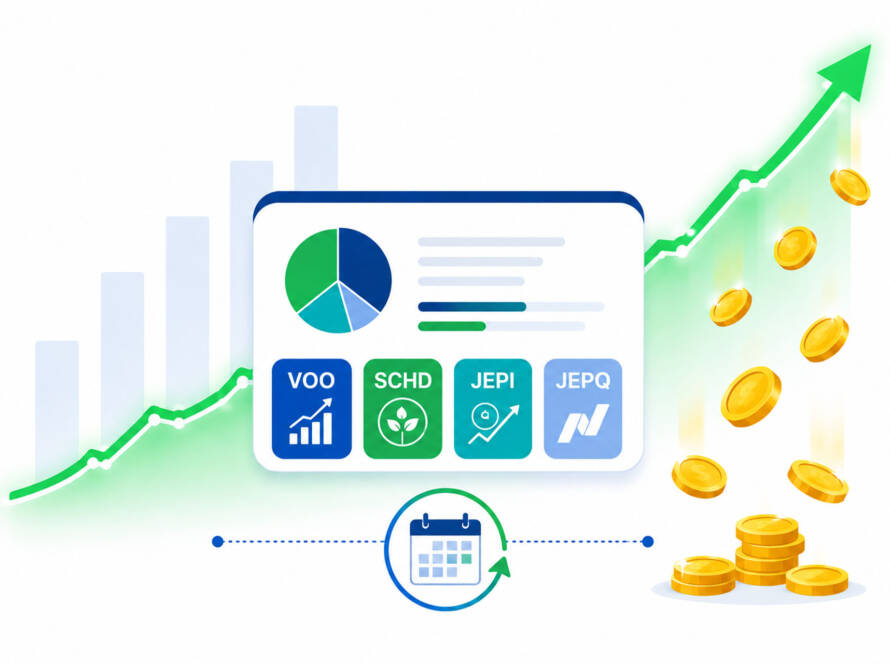
Both JEPI (JPMorgan Equity Premium Income ETF) and JEPQ (JPMorgan Nasdaq Equity Premium Income ETF) are actively managed covered call ETFs issued by JPMorgan Asset Management. They use a two-part strategy to generate high monthly income that most traditional dividend ETFs simply cannot match.
Here is how the strategy works:
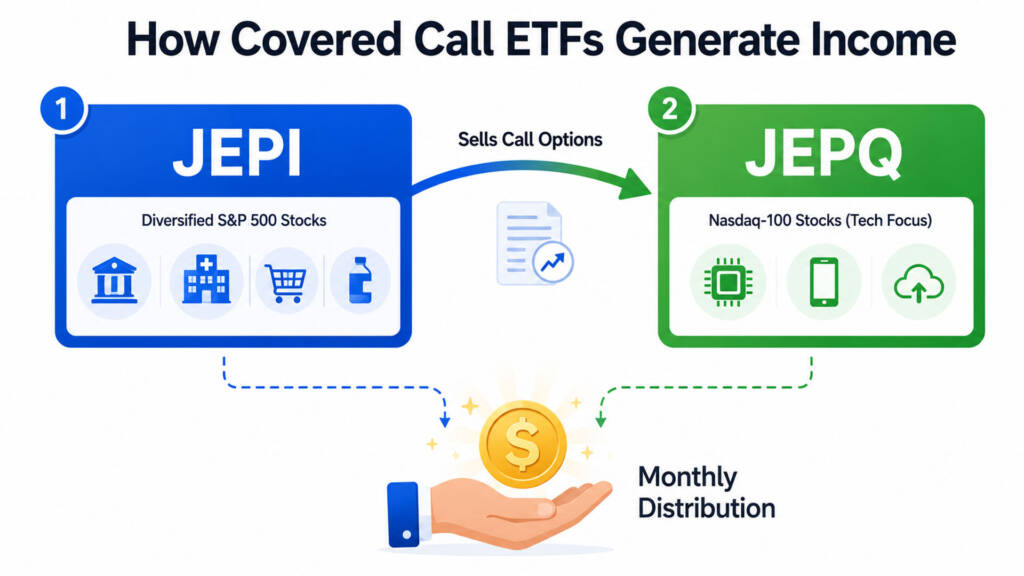
- Equity Portfolio: Each fund holds a diversified basket of stocks — JEPI from the S&P 500 universe, JEPQ from the Nasdaq-100 universe.
- Options Overlay: Each fund systematically sells Equity Linked Notes (ELNs) — structured instruments tied to call options on their respective indices. The premiums collected from selling these options are distributed to shareholders as monthly income.
The trade-off is fundamental. By selling call options, both funds cap their upside during strong bull market rallies. In exchange, they generate substantial, consistent monthly income even when markets move sideways or moderately lower. This makes them particularly attractive for income-focused investors — but potentially frustrating for pure growth investors. To understand the broader ETF investing landscape, read our guide on What Is ETF Investing?
JEPI vs JEPQ: Side-by-Side Comparison (June 2026)
Here is the definitive data snapshot for both funds as of early June 2026:
| Metric | JEPI | JEPQ |
|---|---|---|
| Full Name | JPMorgan Equity Premium Income ETF | JPMorgan Nasdaq Equity Premium Income ETF |
| Issuer | JPMorgan Asset Management | JPMorgan Asset Management |
| Inception Date | May 20, 2020 | May 3, 2022 |
| Benchmark | S&P 500 (defensive tilt) | Nasdaq-100 |
| Expense Ratio | 0.35% | 0.35% |
| Dividend Yield (TTM) | ~8.36%–8.45% | ~10.11%–10.48% |
| Distribution Frequency | Monthly | Monthly |
| 1-Year Return | +7.70% | +19.67% |
| Management Style | Active | Active |
| Volatility | Lower (defensive S&P tilt) | Higher (Nasdaq-100 tech concentration) |
| Top Sector | Diversified defensive (Financials, Health, Consumer) | Technology / Growth |
A Deeper Look at JEPI
JEPI’s Investment Strategy
JEPI does not simply replicate the S&P 500. Instead, it builds a defensively-tilted, lower-volatility stock portfolio using roughly 100–135 stocks selected from the S&P 500 universe. Portfolio managers actively select stocks with lower betas — meaning they move less dramatically than the overall market. On top of this equity base, JEPI sells out-of-the-money call options through ELNs to collect option premiums.
This approach gives JEPI a meaningful edge during volatile or declining markets. Moreover, because the underlying stocks are defensive by nature, JEPI historically experiences smaller drawdowns than a pure S&P 500 index fund during market corrections.
JEPI Top Holdings (April 2026)
- S&P 500 ELN (Options Overlay): ~13.00%
- Broadcom (AVGO): 1.77%
- Ross Stores (ROST): 1.71%
- Amazon (AMZN): 1.70%
- Apple (AAPL): 1.67%
Notice that no single stock dominates JEPI’s portfolio. This wide diversification across 100+ holdings keeps individual stock risk extremely low.
JEPI’s Income Profile
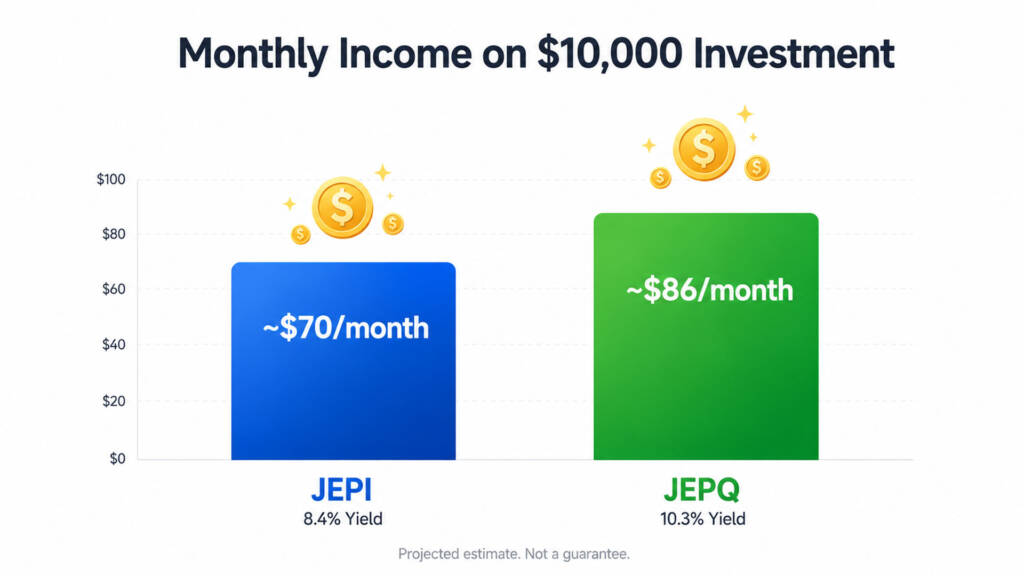
At a trailing yield of approximately 8.36%–8.45%, JEPI generates meaningful monthly income. On a $10,000 investment, that equates to roughly $836–$845 per year, or approximately $70 per month in projected income distributions.
⚠️ Important: Monthly distributions vary based on option premium income, which fluctuates with market volatility. JEPI’s income was reported to yield ~17% lower than its historical average as of early 2026, reflecting a period of compressed volatility.
A Deeper Look at JEPQ
JEPQ’s Investment Strategy
JEPQ takes a nearly identical structural approach to JEPI — but anchors its equity portfolio to the Nasdaq-100 index. This means you get concentrated exposure to the world’s leading technology and growth companies: NVIDIA, Apple, Microsoft, Amazon, Meta, and Alphabet. The same ELN-based covered call overlay generates monthly income on top of this growth-heavy portfolio.
The key difference is that JEPQ participates more in Nasdaq bull markets. Because tech stocks generate richer option premiums (due to their higher inherent volatility), JEPQ consistently yields more than JEPI. However, this also means JEPQ will experience sharper drawdowns during tech selloffs or broader Nasdaq corrections.
JEPQ Top Holdings (April 30, 2026)
According to JPMorgan’s official April 2026 fact sheet, JEPQ’s top holdings include:
- NVIDIA (NVDA): 7.9%
- Apple (AAPL): 8.2% (estimated)
- Microsoft (MSFT)
- Amazon (AMZN)
- Meta Platforms (META)
- Broadcom (AVGO)
- Alphabet (GOOGL/GOOG)
- Tesla (TSLA)
These are the defining AI and tech giants of 2026. Owning JEPQ means you are effectively getting Nasdaq-100 exposure with a monthly income overlay — a combination that has proven highly attractive to income investors who don’t want to completely miss out on the tech rally.
JEPQ’s Income Profile
JEPQ currently yields approximately 10.11%–10.48% on a trailing basis. On a $10,000 investment, that projects to roughly $1,011–$1,048 per year, or approximately $84–$87 per month in income distributions.
Furthermore, JEPQ’s 1-year total return of +19.67% dwarfs JEPI’s +7.70% over the same period — largely driven by the Nasdaq’s strong 2025–2026 performance. This shows that JEPQ investors received both higher income AND better capital appreciation during this period.
Performance Comparison: Which Fund Has Delivered More?
Numbers tell the most honest story. Here is a direct performance comparison based on the most current available data:
| Period | JEPI Return | JEPQ Return |
|---|---|---|
| 1-Year (to June 2026) | +7.70% | +19.67% |
| Since JEPQ Inception (May 2022) | +8.00% (5-yr est.) | Comparable track period |
| Yield (TTM) | ~8.36%–8.45% | ~10.11%–10.48% |
| Monthly Income on $10K | ~$70/month | ~$84–$87/month |
JEPQ has clearly outperformed JEPI over the past year on both total return and income generation. However, this reflects a Nasdaq-favorable environment. During periods of tech weakness or rising interest rates (like 2022), JEPQ would likely underperform JEPI meaningfully.
The Real Trade-Off: Income vs. Capital Preservation
The central tension in JEPI vs JEPQ is not just about yield — it is about how much capital risk you are willing to accept for that yield.
When JEPI Shines
- Sideways or bear markets: JEPI’s defensive stock selection and lower beta protect capital better.
- Retirees or near-retirees who prioritize stable monthly income over growth
- Risk-averse investors who cannot tolerate the sharp drawdowns that come with tech concentration
- Investors who already hold growth-heavy positions and want income without adding tech risk
When JEPQ Shines
- Bull markets and tech rallies: JEPQ participates more in Nasdaq upside before the option cap kicks in.
- Younger income investors (30s–40s) who want high yield AND some growth exposure
- Investors who believe in the long-term dominance of AI and big tech
- Portfolios that already have defensive/dividend positions (like SCHD) and need a growth-income complement
Read our full SCHD ETF Review 2026 to understand how SCHD’s dividend-growth approach compares to both covered call strategies.
JEPI vs JEPQ: Monthly Income Simulation
Let’s compare projected income using current yield data on three investment sizes. These are projected outcomes, not guaranteed returns. Actual distributions will fluctuate month to month.
| Investment Amount | JEPI (~8.40% yield) — Monthly | JEPQ (~10.30% yield) — Monthly |
|---|---|---|
| $5,000 | ~$35/month | ~$43/month |
| $10,000 | ~$70/month | ~$86/month |
| $25,000 | ~$175/month | ~$215/month |
| $50,000 | ~$350/month | ~$429/month |
| $100,000 | ~$700/month | ~$858/month |
The monthly income difference grows more significant at higher investment levels. A $100,000 portfolio in JEPQ generates approximately $158 more per month than the same amount in JEPI — a difference of $1,896 per year.
However, also remember that JEPQ investors accept more price volatility in exchange for that additional income. You can explore more income-generation frameworks in our Passive Income ETF Portfolio guide.
Can You Hold Both JEPI and JEPQ?
Absolutely — and JPMorgan itself suggests combining the two funds for broader income diversification. A 50/50 split between JEPI and JEPQ gives you:
- Blended yield of approximately 9.3%–9.5%
- Exposure to both S&P 500 defensive stocks AND Nasdaq-100 growth stocks
- Smoother income consistency across different market environments
- Reduced concentration risk compared to holding either fund alone
This pairing works especially well as a satellite allocation alongside a core VOO position. For a complete framework on this approach, explore our Core and Satellite Portfolio strategy or our dedicated article on the VOO and JEPQ portfolio combination.
Key Risks Every Investor Must Understand
Both JEPI and JEPQ share several important risks:
- Capped upside: Selling call options limits participation in strong market rallies. During the 2023 Nasdaq recovery, JEPQ significantly underperformed a plain QQQ position in price appreciation.
- Variable distributions: Monthly income fluctuates with options premium levels. Lower market volatility = lower premiums = lower monthly payouts.
- ELN counterparty risk: Both funds use Equity Linked Notes, not direct options. This adds a layer of counterparty risk — though JPMorgan mitigates this by working with multiple major financial institutions.
- Not a replacement for core equity: Neither JEPI nor JEPQ should replace a broad-market core position like VOO. They are income satellites, not portfolio foundations. Review our VOO ETF Core Portfolio guide for proper allocation context.
- Tax considerations: Covered call income is typically taxed as ordinary income, not qualified dividends — which can be less tax-efficient for investors in higher tax brackets. International investors also face a 30% U.S. withholding tax on distributions.
How to Start Investing in JEPI or JEPQ
Getting started is straightforward:
- Open a U.S.-market brokerage account. For international investors, Interactive Brokers offers low-cost access to both ETFs. Start here: IBKR Referral — Invest in JEPI or JEPQ
- Decide your allocation. Neither JEPI nor JEPQ should exceed 20–30% of your total portfolio. Keep VOO as your primary core.
- Choose your fund based on your risk tolerance and market outlook. Conservative income? → JEPI. Growth + income? → JEPQ. Want both? → Split 50/50.
- Implement Dollar-Cost Averaging (DCA) to build your position over time rather than timing the entry. Read our Dollar-Cost Averaging Explained guide for the full strategy.
- Reinvest or collect income. Decide upfront whether you will reinvest monthly distributions (DRIP) to compound growth, or withdraw them as passive income.
Conclusion & Call to Action
Both JEPI and JEPQ are exceptional income tools — but they are built for different investors. JEPI suits conservative, income-first investors who want stability and lower drawdowns. JEPQ suits investors who want higher monthly income and are comfortable with Nasdaq-level volatility in exchange for greater upside participation.
Neither fund is a standalone portfolio solution. The smartest approach is to pair whichever you choose — or both — with a rock-solid core position in VOO to ensure your long-term wealth compounding engine never stalls.
Which fund are you leaning toward — JEPI, JEPQ, or a combination of both? Drop your strategy in the comments below! And if you want to go deeper on building a complete income portfolio, don’t miss our companion article: How to Build a Dividend Portfolio in 2026.
FAQs
Q1: What is the main difference between JEPI and JEPQ in 2026?
A1: The core difference is their underlying equity universe. JEPI builds its portfolio from S&P 500 defensive stocks, targeting lower volatility and a yield of ~8.36%–8.45%. JEPQ anchors to the Nasdaq-100 technology stocks, generating a higher yield of ~10.11%–10.48% but with greater price swings. Both use covered call (ELN) overlays to generate monthly income and charge an identical 0.35% expense ratio. JEPQ has significantly outperformed JEPI on total return over the past year (+19.67% vs. +7.70%), driven by the Nasdaq’s strength in 2025–2026.
Q2: Is JEPI or JEPQ better for passive monthly income?
A2: For pure monthly income yield, JEPQ currently pays more — approximately $84–$87/month versus JEPI’s ~$70/month on a $10,000 investment. However, JEPI’s income is generally more stable across different market conditions because its underlying defensive stocks generate more consistent option premiums. If you prioritize maximum monthly cash flow and can tolerate more volatility, JEPQ wins. If you prioritize income stability and downside protection, JEPI is the stronger choice. Many investors hold both for a blended yield of ~9.3%–9.5%.
Q3: Should I hold JEPI or JEPQ with VOO in my portfolio?
A3: Yes — combining VOO with JEPI and/or JEPQ is a highly effective core-and-satellite strategy. VOO provides your long-term growth engine and broad market diversification without the upside cap. JEPI or JEPQ then adds monthly income on top of that growth foundation. A common allocation is 60–70% VOO, 15–20% JEPI or JEPQ as the income satellite. This structure ensures you benefit from full market upside through VOO while still collecting meaningful monthly cash flow from your covered call positions. Read our VOO and JEPQ Portfolio article for a complete breakdown of this strategy.
Financial Disclaimer: This article is for educational and informational purposes only and does not constitute financial, investment, tax, or legal advice. All yield figures, performance data, and income projections referenced reflect current or historical information and are not a guarantee of future results. Covered call ETFs like JEPI and JEPQ involve risks including variable distributions, capped upside, counterparty risk associated with ELNs, and potential capital loss. Monthly income distributions will fluctuate based on market volatility and options premium conditions. International investors should also consider withholding tax implications in their respective jurisdictions. Always conduct your own due diligence and consult a licensed financial advisor before making any investment decisions.