Most people spend their entire careers trading time for money — one paycheck, one week at a time. But what if your investment portfolio could quietly deposit $500 every single month into your account, whether you’re working, sleeping, or on vacation? For millions of investors, that’s exactly what a well-structured passive income ETF portfolio makes possible. The problem is that most beginners have no idea where to start — they either chase the highest yields recklessly, pile into a single fund, or give up because the goal feels too far away. The good news? In 2026, the ETF market offers a powerful lineup of income-generating funds — from covered-call ETFs to time-tested dividend growers — that make building a $500/month income stream more achievable than ever.
Key Takeaways:
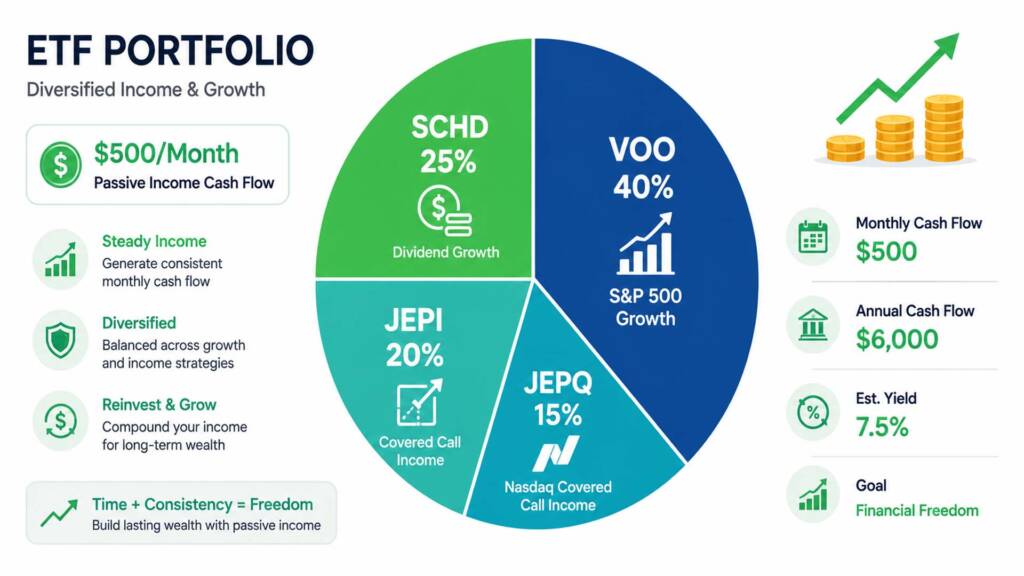
- A diversified passive income ETF portfolio combining VOO, SCHD, JEPI, and JEPQ can realistically generate $500/month in income with the right capital base.
- Covered-call ETFs like JEPI (8.28% yield) and JEPQ (10.06% yield) can dramatically accelerate your income timeline while VOO anchors long-term growth.
- Dollar-cost averaging (DCA) allows investors starting with modest capital to systematically build toward their $500/month goal over time.
Why ETFs Are the Smartest Tool for Passive Income
Before diving into the portfolio itself, it helps to understand why ETFs are uniquely suited for generating passive income. Unlike picking individual dividend stocks, ETFs give you instant diversification across hundreds — sometimes thousands — of companies in a single trade. This reduces the risk of a single company cutting its dividend and derailing your entire income strategy.
If you’re new to how ETFs work, our in-depth guide on ETF investing is the perfect starting point. Moreover, most income-focused ETFs carry very low expense ratios, meaning more of the fund’s returns stay in your pocket rather than going to fund managers. This cost efficiency compounds significantly over time, especially when you reinvest your dividends.
ETFs also trade on major stock exchanges just like regular stocks, making them accessible to both US-based and international investors through global brokers. Platforms like Interactive Brokers make it easy to access the full US ETF market even from outside the United States, with commission-free or very low-cost trades.
The $500/Month Math: How Much Capital Do You Need?
This is the first question every income investor asks — and the honest answer depends on your portfolio’s blended yield. Here’s the simple formula:
Annual Income Target ÷ Portfolio Yield = Capital Required
For $500/month, you need $6,000/year in income. Let’s look at what different blended yields mean for your capital requirement:
| Blended Portfolio Yield | Capital Needed for $6,000/Year |
|---|---|
| 3.5% (conservative) | ~$171,400 |
| 5.0% (moderate) | ~$120,000 |
| 6.5% (moderate-aggressive) | ~$92,300 |
| 8.0% (aggressive) | ~$75,000 |
A balanced passive income ETF portfolio targeting a 5%–6.5% blended yield hits the sweet spot — enough income to reach your goal without taking on excessive risk from ultra-high-yield instruments. With the 4-ETF portfolio strategy outlined below, a blended yield of approximately 6.0%–6.5% is achievable in 2026, meaning a capital target of roughly $92,000–$100,000.
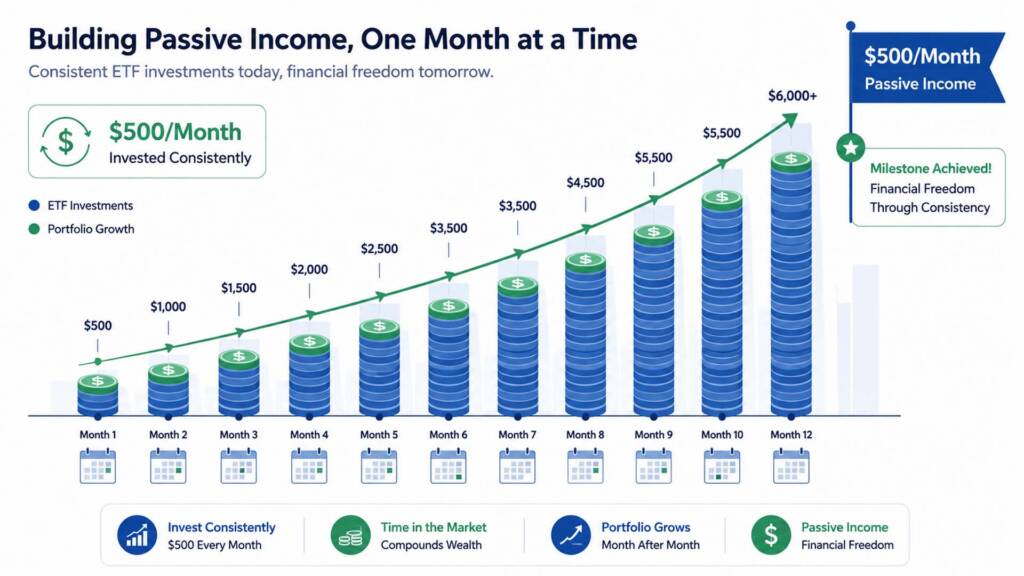
The Power of Dollar-Cost Averaging
You don’t need $100,000 sitting in your bank account today. With a disciplined dollar-cost averaging strategy, you invest a fixed amount regularly — say $1,000 to $1,500/month — and let your portfolio grow toward that target. Reinvesting dividends along the way (DRIP — Dividend Reinvestment Plan) supercharges the compounding effect, as we’ll explore below.
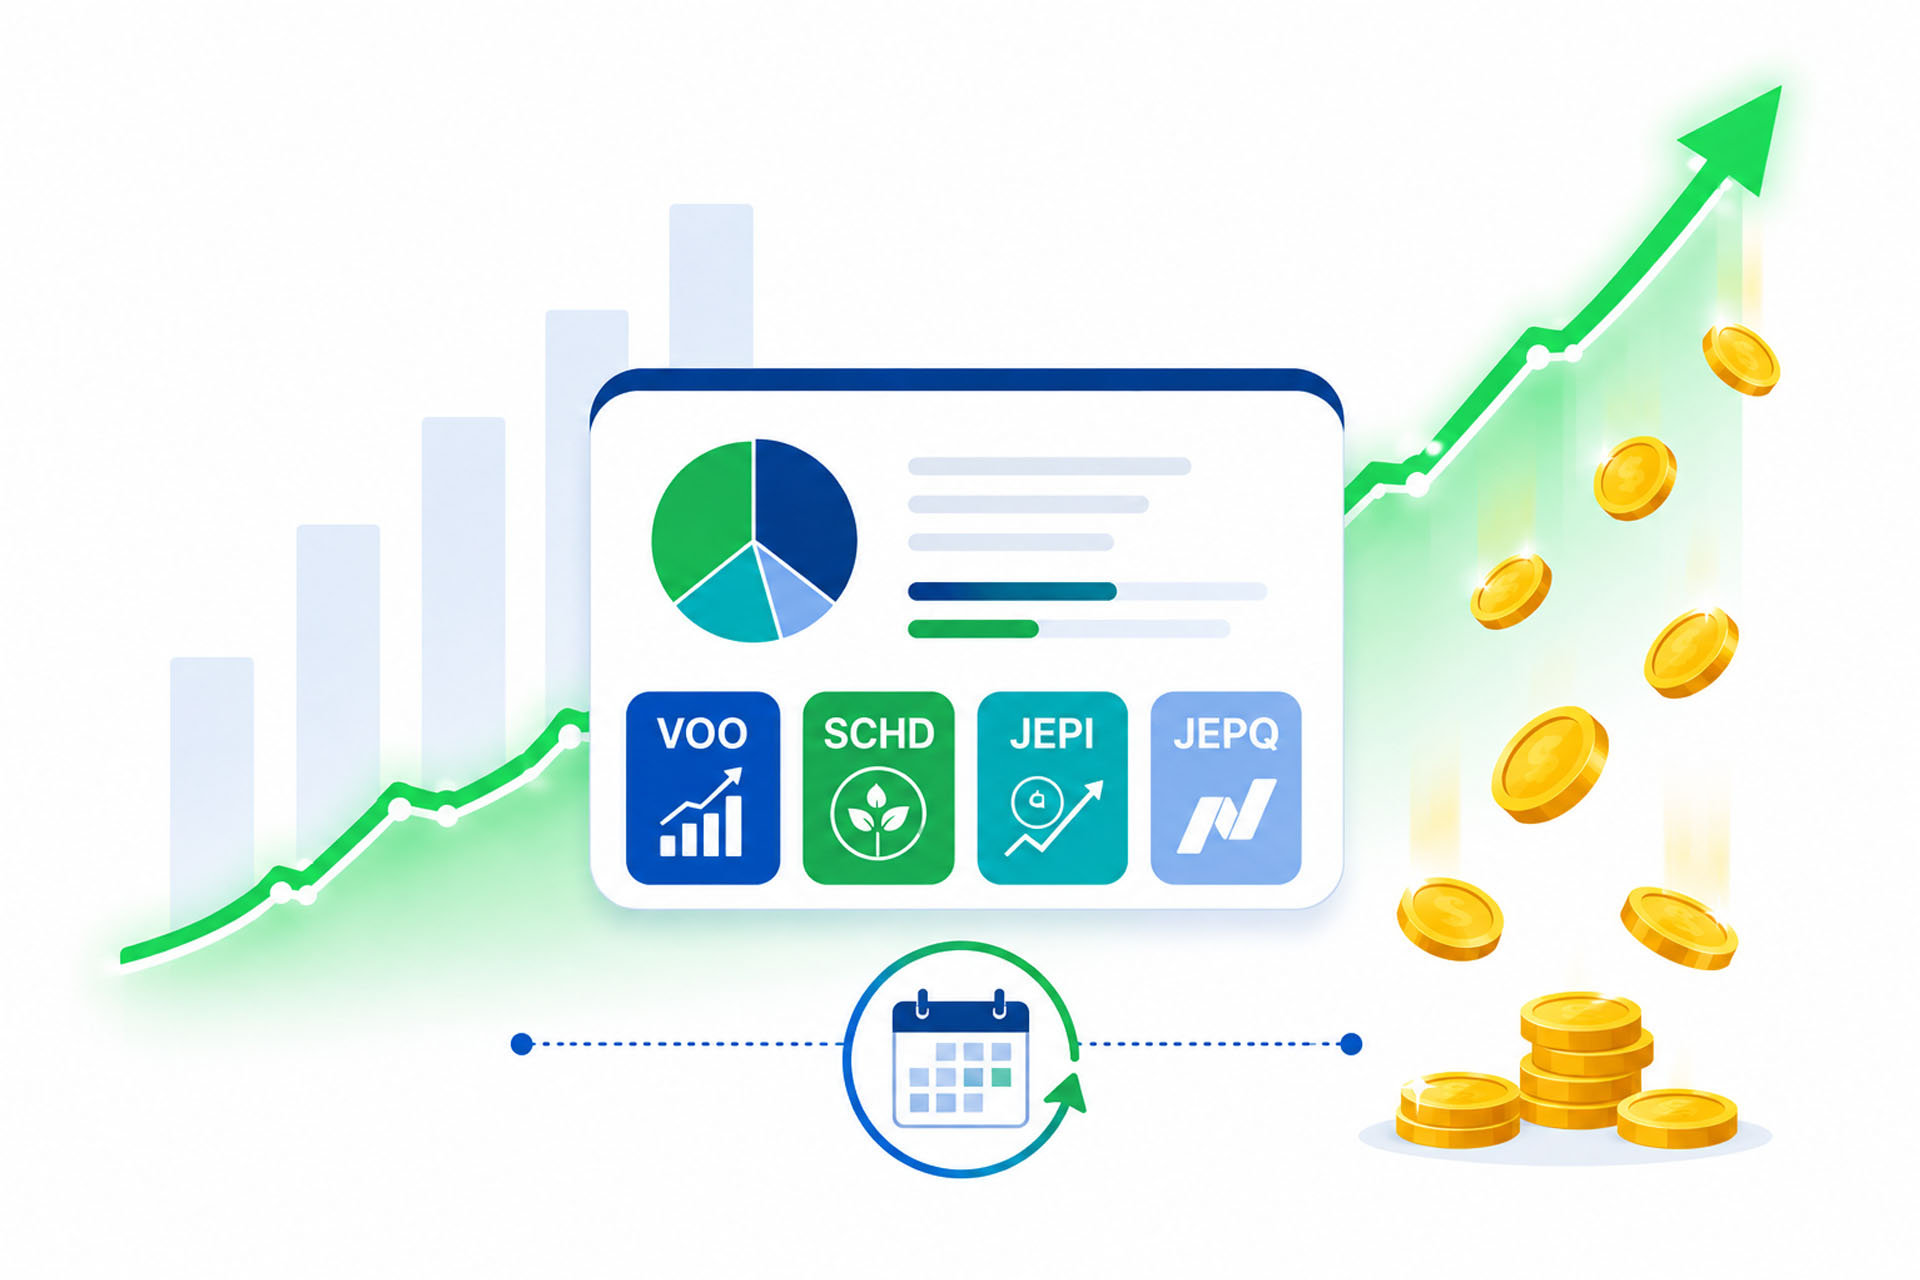
The Core 4-ETF Passive Income Portfolio
This portfolio follows a Core-and-Satellite framework: a stable, broad-market core for long-term growth, paired with high-income satellite positions that generate immediate cash flow. You can learn more about this framework in our core and satellite portfolio guide.
ETF 1: VOO (Vanguard S&P 500 ETF) — The Growth Core
Allocation: 40% | Dividend Yield: ~1.3% | Expense Ratio: 0.03%
VOO is the non-negotiable foundation of this portfolio. It tracks the S&P 500 — 500 of the largest US companies — and has delivered a 10-year annualized return of 14.1% and a 5-year annualized return of 12% as of 2026. While VOO’s dividend yield is modest (~1.3%), its role here is capital appreciation — growing the total portfolio size over time so that your income-generating ETFs compound on a larger base.
VOO also keeps costs nearly invisible with its 0.03% expense ratio, the lowest available in the market. Think of VOO as the engine in your portfolio — it may not pay much in dividends today, but it ensures your total wealth is growing year after year. For a deeper analysis, check out VOO vs. SPY in 2026.
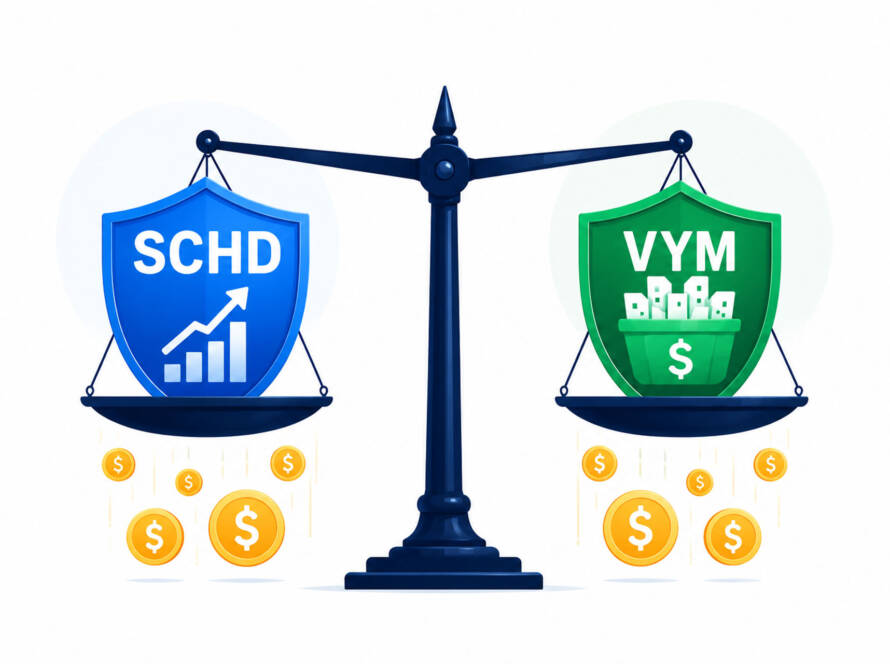
ETF 2: SCHD (Schwab U.S. Dividend Equity ETF) — The Dividend Grower
Allocation: 25% | Dividend Yield: ~3.26% | Expense Ratio: 0.06%
SCHD is widely regarded as the best dividend growth ETF available to US investors. As of June 2026, SCHD carries a dividend yield of approximately 3.26% and just paid its Q1 2026 dividend of $0.2569/share — a 3.3% year-over-year increase, marking the largest Q1 payout in the ETF’s history.
Unlike high-yield ETFs that may sacrifice growth, SCHD selects companies with strong fundamentals, financial health, and a history of consistent dividend increases. This makes it the perfect bridge between income and growth. To see how SCHD stacks up against its closest competitor, read our detailed SCHD vs. DGRO 2026 comparison.
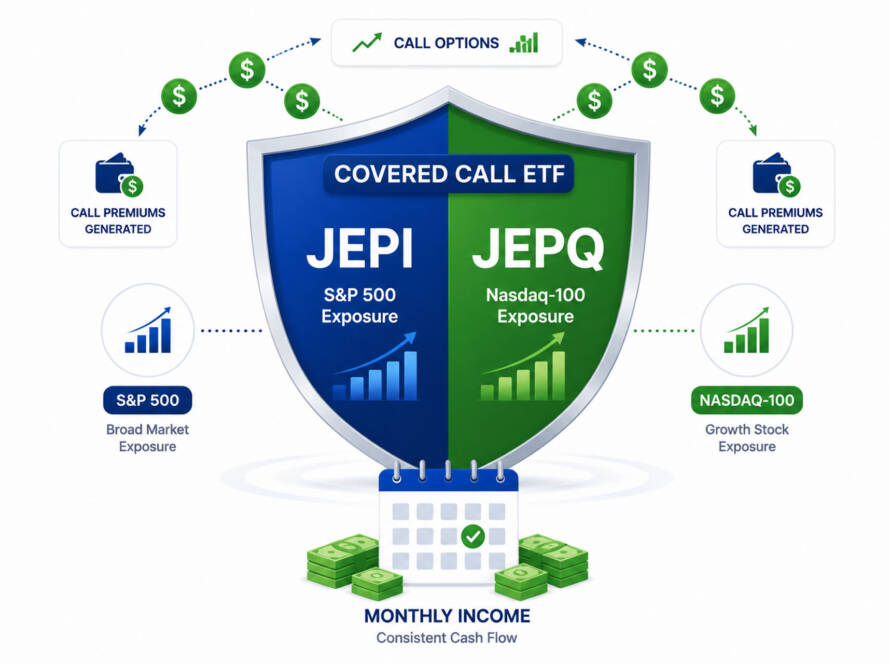
ETF 3: JEPI (JPMorgan Equity Premium Income ETF) — The Monthly Income Engine
Allocation: 20% | Dividend Yield: ~8.28% | Payout: Monthly
JEPI is a covered-call ETF that generates income by selling options contracts on its equity holdings, then distributing that premium to shareholders monthly. As of June 2026, JEPI’s trailing dividend yield stands at 8.28%, with the most recent monthly payment of $0.39/share paid on June 3, 2026.
JEPI provides immediate, substantial income and — critically — it pays every single month, making it ideal for investors who want predictable cash flow. The trade-off is that its income can fluctuate with market volatility, and it caps some upside potential. This makes it a complementary satellite holding rather than a core position. Explore how JEPI works in a portfolio context in our VOO and JEPQ portfolio deep dive.
ETF 4: JEPQ (JPMorgan Nasdaq Equity Premium Income ETF) — The High-Yield Booster
Allocation: 15% | Dividend Yield: ~10.06% | Payout: Monthly
JEPQ applies the same covered-call strategy as JEPI, but targets Nasdaq-100 stocks — giving it more growth exposure while still generating exceptional monthly income. As of June 2026, JEPQ’s trailing yield is a remarkable 10.06%, with the most recent monthly distribution of $0.56/share paid on June 3, 2026.
Because of its Nasdaq-100 exposure, JEPQ carries more volatility than JEPI but offers significantly higher income. Together, JEPI and JEPQ form the high-yield income engine of this portfolio, funded by the long-term stability provided by VOO and SCHD.
Portfolio Simulation: $500/Month Income Target
Let’s run a real-world simulation using June 2026 data. Assume a total portfolio of $100,000:
At $100,000, this portfolio generates approximately $375/month. To reach $500/month (~$6,000/year), you’d need to grow the portfolio to approximately $133,000, or slightly increase the allocation toward JEPI/JEPQ.
Getting to $133,000: A DCA Roadmap
If you’re starting from $20,000 and contributing $1,000/month:
- At a blended total return of approximately 8%/year (income + growth), you would reach $133,000 in approximately 8 years.
- If you reinvest all dividends (DRIP), you could reach that target in 6–7 years thanks to the dividend snowball effect.
- Starting contributions earlier — even at $500/month — reduces the timeline dramatically compared to waiting.
These are projected outcomes based on historical returns and current yields, not guaranteed results. For a broader perspective on building a dividend-focused portfolio in 2026, see our guide on how to build a dividend portfolio in 2026.
How to Reinvest Dividends for Faster Growth
One of the most powerful wealth-building tools available is the Dividend Reinvestment Plan (DRIP). Instead of taking your income as cash, you automatically reinvest every dividend payment to purchase additional ETF shares. Over time, those additional shares generate even more dividends — a self-reinforcing cycle that accelerates your path to $500/month.
Here’s a simple example: if your $25,000 SCHD position pays $815/year in dividends and you reinvest all of it at a 3.26% yield, you buy approximately $815 worth of new SCHD shares. Those new shares then pay you dividends in the next cycle. Over 10 years, this compounding effect can increase your income by 30–50% beyond what simple contributions alone would achieve.
Most major brokers, including Interactive Brokers, offer free DRIP enrollment. Setting it up takes only a few minutes and is one of the most impactful decisions a passive income investor can make.
Common Mistakes to Avoid
Even the best passive income ETF portfolio strategy can be derailed by avoidable errors. Watch out for these:
- Chasing yield blindly — A 15% yield ETF is not automatically better than a 5% one. Unsustainably high yields often come with declining NAV (net asset value), which erodes your principal.
- Ignoring portfolio rebalancing — Markets shift allocations over time. Review and rebalance periodically to maintain your target weights. Our guide on how often to rebalance your portfolio offers a clear framework.
- Confusing growth and income investing — VOO is a growth ETF first; don’t expect it to contribute significantly to monthly income. Its role is portfolio appreciation.
- Panicking during corrections — VOO was briefly down 7% from its January 2026 highs earlier this year. Selling during volatility locks in losses and permanently damages your compounding trajectory. See our guide on what to do when the stock market crashes for perspective.
- Neglecting tax efficiency — International investors especially should be aware of US withholding taxes on dividends (typically 15%–30% depending on tax treaty). Always consult a tax professional. Learn more about common beginner investor mistakes.
Growth vs. Dividend Investing: Finding Your Balance
A purely dividend-focused portfolio risks sacrificing long-term wealth accumulation. This is why the 40% VOO allocation is critical — it ensures your portfolio grows in total value, not just in income. As your VOO allocation appreciates, you can periodically rotate a portion of gains into higher-yield positions like JEPI or JEPQ to increase your income stream over time.
This balance — between growth and dividend investing — is the defining principle of sustainable passive income investing. The investors who reach $500/month fastest are not those who maximize yield today, but those who intelligently grow their capital base while collecting consistent income along the way.
Conclusion & Call to Action
Building a passive income ETF portfolio that generates $500/month is a realistic, achievable goal — but it requires a clear strategy, the right ETF selection, and the discipline to stay consistent. By anchoring your portfolio with VOO for long-term growth, adding SCHD for dividend quality and income growth, and boosting monthly income with JEPI and JEPQ, you create a well-rounded engine for financial freedom.
The data is clear: in 2026, a $100,000 balanced portfolio across these four ETFs can realistically generate $375–$450/month, with a path to $500+/month as your capital grows. Start where you are, invest consistently, reinvest your dividends, and let compounding do the heavy lifting.
Ready to take the next step? Drop a comment below sharing your current passive income goal and which ETF you plan to start with. Also, make sure to read our related article: 3-ETF Portfolio Strategy for Beginners for a simpler alternative structure to get started today.
Frequently Asked Questions
Q1: How much money do I need to invest in a passive income ETF portfolio to make $500 per month?
A1: Based on June 2026 yields, you need approximately $100,000–$133,000 invested in a blended portfolio of income ETFs (like JEPI, JEPQ, and SCHD) combined with a growth anchor like VOO to reach $500/month. The exact amount depends on your blended yield. At a 5% blended yield, you need $120,000; at 6%, you need $100,000.
Q2: What are the best ETFs for a passive income portfolio in 2026?
A2: The top ETFs for passive income in 2026 include: JEPI (8.28% monthly dividend yield), JEPQ (10.06% monthly dividend yield), SCHD (3.26% quarterly dividend yield with consistent growth), and VOO for long-term capital appreciation with a 10-year annualized return of 14.1%. Each serves a different role in a balanced income portfolio.
Q3: Is it safe to rely on covered-call ETFs like JEPI and JEPQ for passive income?
A3: JEPI and JEPQ are legitimate, professionally managed ETFs by JPMorgan, but they carry specific risks. Their monthly distributions can fluctuate based on market volatility — higher volatility generally produces more options premium income, while calm markets may reduce payouts. Additionally, covered-call strategies cap the fund’s upside during strong bull markets. This is why limiting JEPI/JEPQ to a satellite allocation (20–35% combined) while maintaining a growth core (VOO) is the prudent approach recommended for most investors.
Financial Disclaimer: This article is intended for educational and informational purposes only and does not constitute financial advice, investment advice, or a recommendation to buy or sell any security. All data references historical and projected outcomes, which do not guarantee future results. ETF yields and prices fluctuate and may differ from figures cited at the time of reading. Always conduct your own due diligence and consult a licensed financial advisor before making any investment decisions. International investors should also consult a tax professional regarding withholding taxes and local regulations applicable to US ETF investments.