When investors discuss dividend ETFs, SCHD dominates the conversation. And that is fair — SCHD is exceptional. But while everyone stares at SCHD, one of the most intelligently constructed dividend growth ETFs available quietly keeps outperforming, growing its dividend, and building wealth for patient investors. It is called DGRO — the iShares Core Dividend Growth ETF by BlackRock. This DGRO ETF review exists because DGRO deserves a serious look that it rarely gets. It has delivered a 25.14% 1-year total return as of June 2026, grown its dividend at roughly 11% annually over the past decade, holds over 400 carefully screened U.S. stocks, and charges just 0.08% per year in fees. For investors who want quality dividend growth without yield-chasing risk, DGRO may be the most underrated ETF in the dividend space today. Let’s dig into every metric that matters.
Key Takeaways:
- DGRO screens for dividend quality, not just yield — it excludes the top 10% highest-yielding stocks to eliminate yield traps, requires 5+ consecutive years of dividend growth, and caps individual holdings at 3% for maximum diversification.
- DGRO has delivered ~11% annual dividend growth over the past decade — matching SCHD’s growth rate while maintaining broader diversification across ~400 holdings vs SCHD’s concentrated ~100.
- The 1-year total return through mid-2026 is approximately 25%, with a YTD gain of ~3–8% depending on the measurement period, demonstrating DGRO’s resilience relative to many peers in a volatile 2026 market environment.
What Is DGRO? Fund Overview and History
DGRO — the iShares Core Dividend Growth ETF — is a passively managed ETF launched by BlackRock on June 10, 2014. It tracks the Morningstar US Dividend Growth Index, a rules-based benchmark that screens the U.S. equity universe for high-quality dividend growers — not just high-yield payers.
As of June 2026, DGRO manages approximately $40 billion in assets under management (AUM), making it one of the largest dividend-focused ETFs in the U.S. market. Yet despite this scale, DGRO rarely tops dividend ETF “best of” lists — largely because its current yield of ~2.5% is lower than SCHD’s ~3.2–3.8%, making it less immediately exciting to income-seeking investors.
That focus on current yield, however, misses the point of DGRO entirely. DGRO is built for total return compounding over the long term — combining a growing dividend stream with meaningful capital appreciation. If you want a deeper foundation on dividend growth principles, our guide to dividend growth investing for beginners explains why dividend growth rate often matters more than current yield.
The Morningstar US Dividend Growth Index: DGRO’s Secret Weapon
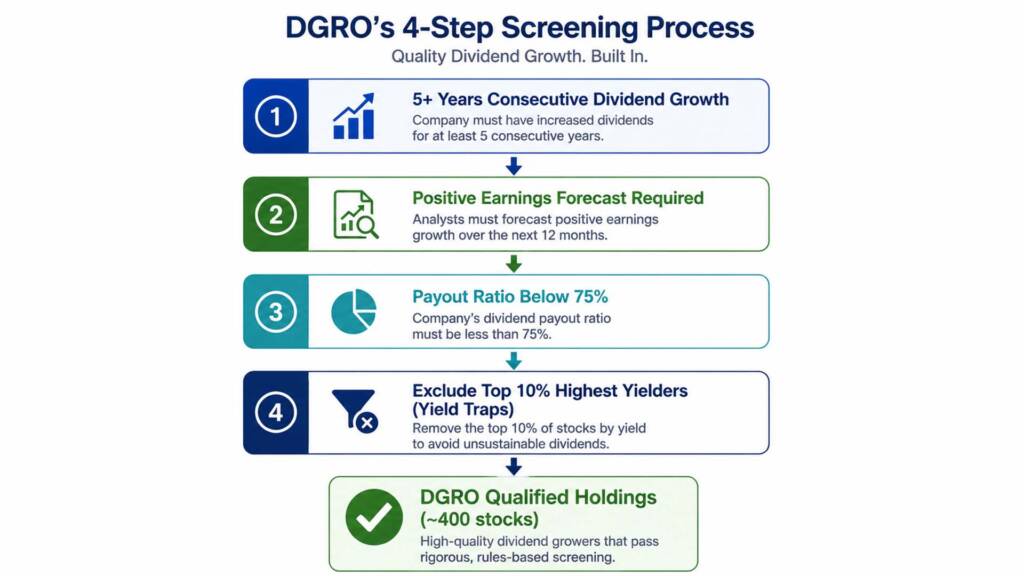
What truly separates DGRO from other dividend ETFs is the quality of its index methodology. The Morningstar US Dividend Growth Index applies four rigorous screening layers before any stock earns a place in the fund:
Screen 1 — Five Consecutive Years of Dividend Growth:
Every stock in DGRO must have raised its dividend for at least five uninterrupted years. This filters out companies that pay dividends opportunistically but lack the earnings consistency to sustain and grow them.
Screen 2 — Positive Consensus Earnings Forecast:
Only companies that Wall Street analysts expect to grow earnings are eligible. This forward-looking criterion ensures DGRO holds companies that can afford to keep increasing dividends — not just those that have done so historically.
Screen 3 — Payout Ratio Below 75%:
Companies distributing more than 75% of earnings as dividends are excluded. A high payout ratio is often a warning sign — it leaves little room for reinvestment, debt reduction, or dividend safety in a downturn. DGRO systematically avoids this risk.
Screen 4 — Exclude the Top 10% Highest Yielders (Yield Trap Filter):
This is DGRO’s most counterintuitive — and most brilliant — rule. The highest-yielding stocks are excluded. Why? Because extremely high yields often signal a stock in distress: a falling share price inflates the yield percentage, disguising a company about to cut its dividend. By screening these out, DGRO avoids the “dividend traps” that destroy income portfolios.
Weighting Methodology:
After screening, holdings are weighted by the total dollar value of dividends paid — not market cap. This means a stock paying $5 billion in total annual dividends gets more weight than a stock paying $1 billion, even if the latter has a higher yield percentage. Individual holdings are also capped at 3% to prevent concentration risk. The result: a highly diversified, quality-screened, dividend-weighted portfolio that no other major ETF quite replicates.
DGRO Key Statistics — June 2026
Here is a full snapshot of DGRO’s current data:
| Metric | DGRO Data (June 2026) |
|---|---|
| Full Name | iShares Core Dividend Growth ETF |
| Issuer | BlackRock (iShares) |
| Ticker | DGRO |
| Inception Date | June 10, 2014 |
| Index Tracked | Morningstar US Dividend Growth Index |
| AUM | ~$40 Billion |
| NAV (approx.) | ~$74–$75 |
| Expense Ratio | 0.08% |
| Trailing 12-Month Yield | ~2.5–2.67% |
| 10-Year Dividend Growth Rate | ~11% annually |
| YTD Total Return (2026) | ~3–8% |
| 1-Year Total Return | ~25% |
| 3-Year NAV Total Return | ~52.5% |
| Number of Holdings | ~400–404 |
| Beta (5-Year) | 0.70–0.80 |
| Distribution Frequency | Quarterly |
| % in Top 10 Holdings | ~26–29% |
DGRO’s beta of 0.70–0.80 is particularly noteworthy. It means DGRO moves roughly 25–30% less than the broader S&P 500 in both directions — offering meaningful downside cushion during corrections while still participating substantially in bull markets. That is the hallmark of a high-quality, lower-volatility equity holding.
DGRO’s Top Holdings and Sector Allocation
DGRO’s broad diversification across ~400 stocks means no single company can dominate performance. The 3% individual position cap ensures balanced exposure across all holdings. Here are the current top 10 holdings:
| Rank | Company | Sector | Portfolio Weight |
|---|---|---|---|
| 1 | JPMorgan Chase & Co (JPM) | Financial Services | ~3.12% |
| 2 | Apple Inc (AAPL) | Technology | ~3.10% |
| 3 | Microsoft Corp (MSFT) | Technology | ~3.05% |
| 4 | Johnson & Johnson (JNJ) | Healthcare | ~3.00% |
| 5 | Exxon Mobil Corp (XOM) | Energy | ~2.98% |
| 6 | AbbVie Inc (ABBV) | Healthcare | ~2.95% |
| 7 | Broadcom Inc (AVGO) | Technology | ~2.40% |
| 8 | Procter & Gamble Co (PG) | Consumer Staples | ~2.21% |
| 9 | The Home Depot Inc (HD) | Consumer Cyclical | ~2.03% |
| 10 | UnitedHealth Group (UNH) | Healthcare | ~1.99% |
Sector Breakdown
DGRO’s sector allocation reflects its quality-growth bias:
| Sector | Allocation |
|---|---|
| Financial Services | ~20% |
| Information Technology | ~19–20% |
| Healthcare | ~17% |
| Consumer Staples | ~11% |
| Industrials | ~10–11% |
| Utilities | ~6–7% |
| Consumer Discretionary | ~5–6% |
| Energy | ~5% |
| Materials | ~2.5% |
| Communication Services | ~0.1% |
This allocation stands in sharp contrast to SCHD, which is heavily concentrated in Consumer Staples and Financials while having minimal Technology exposure. DGRO’s ~20% Technology weighting — including Apple, Microsoft, and Broadcom — gives it meaningful participation in the growth of the digital economy, which partly explains its strong 2025–2026 total return performance.
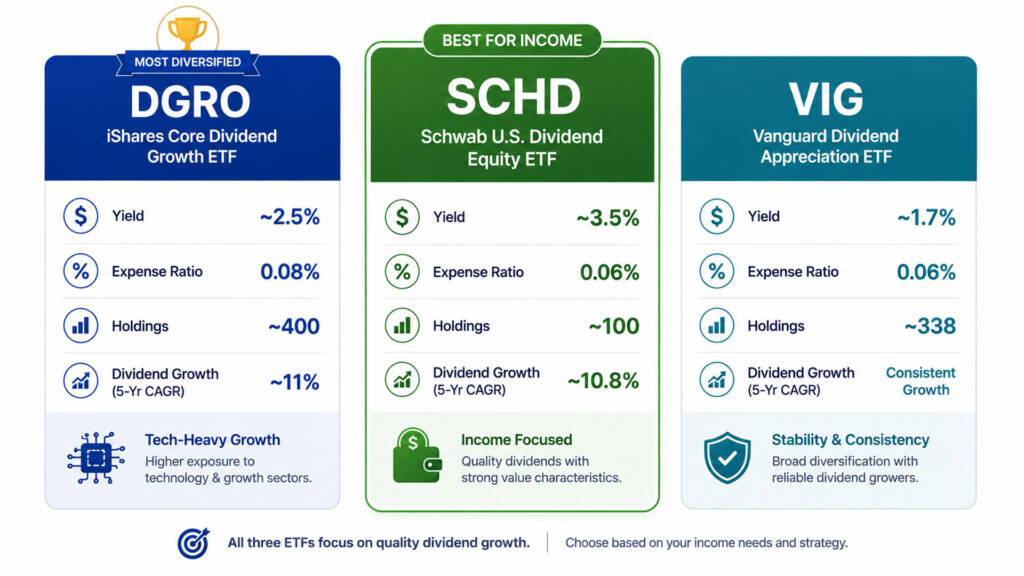
DGRO vs SCHD vs VIG: How Does It Stack Up?
Let’s compare the three most respected dividend growth ETFs in 2026 directly:
| Feature | DGRO | SCHD | VIG |
|---|---|---|---|
| Issuer | BlackRock | Schwab | Vanguard |
| Inception | June 2014 | Oct 2011 | Jan 2006 |
| AUM | ~$40B | ~$65–$70B | ~$102B |
| Expense Ratio | 0.08% | 0.06% | 0.06% |
| Trailing Yield | ~2.5% | ~3.4–3.8% | ~1.7–2.0% |
| Dividend Growth (10-yr) | ~11% annually | ~10.8% annually | Consistent (lower) |
| Holdings Count | ~400 | ~101 | ~338 |
| YTD Return (2026) | ~3–8% | Outperforming | Moderate |
| Beta (5-Year) | 0.70–0.80 | ~0.75 | ~0.80 |
| Technology Exposure | ~20% | Very low | Moderate |
| Div Growth Requirement | 5+ years | 10+ years | 10+ years |
| Yield Trap Filter | ✅ Yes | ✅ Yes | ✅ Yes |
| Payout Ratio Filter | ✅ Yes | ✅ Yes | ❌ No |
The picture is nuanced. SCHD wins on current yield — making it the top choice for investors who need income today. VIG wins on consistency — its 10-year dividend growth requirement is the strictest of the three. But DGRO wins on diversification, technology exposure, and the payout ratio safety filter — making it the most balanced option for long-term total return compounders.
The critical nuance: DGRO’s ~11% annual dividend growth rate rivals SCHD’s, meaning that even starting with a lower current yield, DGRO’s income eventually catches up and then grows in parallel — all while providing exposure to sectors (Technology, Healthcare) that SCHD largely underweights.
For a head-to-head analysis of SCHD and DGRO across every metric, our dedicated SCHD vs DGRO 2026 comparison article provides the definitive breakdown.
DGRO’s Dividend Growth: The 10-Year Income Projection
Understanding DGRO’s power requires modeling how its dividend compounds over time. Based on DGRO’s historical ~11% annual dividend growth rate, here is how a $100,000 DGRO investment (initial yield ~2.5%) projects over 20 years:
| Year | Portfolio Value* | Dividend Yield on Cost | Annual Dividend Income |
|---|---|---|---|
| Year 1 | $100,000 | 2.5% | $2,500 |
| Year 5 | ~$148,000 | ~3.9% | ~$4,112 |
| Year 10 | ~$225,000 | ~6.5% | ~$7,050 |
| Year 15 | ~$342,000 | ~10.8% | ~$11,625 |
| Year 20 | ~$520,000 | ~18.0% | ~$19,200 |
Portfolio value assumes ~8% annual price appreciation. Dividend income assumes ~11% annual dividend growth compounded. These are illustrative projections, not guaranteed outcomes.
By Year 10, your yield on cost climbs from 2.5% to ~6.5% — entirely from dividend growth, without adding a single dollar. This is the dividend snowball effect in its purest form — and it is why patient, long-horizon investors consistently choose dividend growth ETFs like DGRO over high-yield alternatives.
DGRO’s 2026 Performance in Context
In 2026, DGRO has demonstrated a quiet but powerful resilience that defines dividend growth investing at its best.
Even as the broader S&P 500 faced significant volatility in early 2026, DGRO delivered a positive YTD return of over 2% in early March 2026 when the S&P 500 was still in negative territory. Over the trailing 12 months through mid-2026, DGRO’s total return reached approximately 25% — a standout result in the dividend ETF category.
Furthermore, according to Seeking Alpha and market commentary through 2026, dividend investing as a category is outperforming technology and AI growth stocks on a risk-adjusted basis this year — a reversal from the previous three years. DGRO sits at the center of this rotation, benefiting from its balanced exposure across Financials, Healthcare, and Technology.
Who Should Own DGRO?
DGRO is an excellent fit for a wide range of investors:
DGRO is ideal for:
- Long-term accumulators in their 20s–40s who prioritize total return and growing income over current yield
- FIRE investors building a portfolio over a 15–25-year horizon — DGRO’s 11% dividend growth will produce substantial yield-on-cost by retirement
- Investors who want technology exposure within a dividend framework — DGRO’s ~20% tech allocation meaningfully differentiates it from SCHD
- Conservative investors who want equity growth with a beta of 0.70–0.80 — lower volatility than the S&P 500 but higher than pure bond alternatives
- Diversification seekers — DGRO’s ~400 holdings across 9 sectors provide exceptional company-specific risk management
DGRO is less ideal for:
- Retirees needing maximum current income today — the ~2.5% current yield may not cover living expenses without a very large portfolio
- Investors prioritizing the highest income per dollar invested — SCHD (~3.5%) or covered call ETFs like JEPI (~8.5%) generate more immediate cash flow
How to Use DGRO in Your Portfolio
DGRO works beautifully in multiple portfolio roles:
As a SCHD Complement (Not Replacement)
Many sophisticated investors pair DGRO + SCHD rather than choosing one. SCHD brings higher current income and Consumer Staples/Financials exposure. DGRO adds broader diversification, Technology exposure, and the payout ratio safety filter. Together, they cover the dividend growth universe more completely than either alone.
A 50% DGRO / 50% SCHD dividend core (perhaps 30–40% of a total portfolio) blended with VOO as the primary growth anchor creates a highly balanced foundation. This structure captures full S&P 500 market participation through VOO while building a growing dividend income stream through the DGRO/SCHD combination. Our 3-ETF portfolio strategy guide walks through this exact approach with practical allocation percentages.
As a Core-and-Satellite Satellite
In a core-and-satellite portfolio structure, DGRO serves exceptionally well as a quality satellite alongside a VOO core. The VOO core (60–70%) provides maximum long-term compounding, while a 15–20% DGRO satellite adds dividend income and lower-volatility equity exposure.
Tax Location Strategy
Like SCHD, DGRO’s qualified dividends benefit from preferential 0–20% tax rates. This makes DGRO efficient in taxable brokerage accounts. Investors holding both DGRO and covered call ETFs (JEPQ, JEPI) should ideally hold DGRO in taxable accounts (for qualified dividend rates) and JEPQ in Roth IRAs (to shelter ordinary income distributions).
A Simple Compounding Simulation: $500/Month Into DGRO
Here is what $500/month invested in DGRO — a modest but consistent commitment — projects to over 20 years using ~10% annualized total returns (conservative, below DGRO’s recent performance):
| Timeframe | Total Contributed | Projected Portfolio Value | Est. Annual Dividend Income |
|---|---|---|---|
| 5 Years | $30,000 | ~$39,000 | ~$975 |
| 10 Years | $60,000 | ~$103,000 | ~$2,575 |
| 15 Years | $90,000 | ~$207,000 | ~$5,175 |
| 20 Years | $120,000 | ~$382,000 | ~$9,550 |
Assumes 10% annualized total return and ~2.5% current yield growing at ~11%/year. Illustrative only — not a guarantee of future results.
Over 20 years, a $500/month habit turns $120,000 in contributions into a $382,000 portfolio generating ~$9,550 per year in dividends — without ever selling a single share. That is the compounding math that makes DGRO one of the most powerful long-term wealth-building tools available to everyday investors. For further reference, iShares official DGRO fund page and Morningstar’s ETF analysis provide authoritative data directly from the fund issuer.
Start building your DGRO position today through Interactive Brokers — commission-free trading with full access to all major dividend ETFs for both U.S. and international investors.
Conclusion & Call to Action
After this comprehensive DGRO ETF review, the verdict is clear: DGRO is not the flashiest dividend ETF, but it may be the most intelligently constructed. Its four-layer quality screening eliminates yield traps and financially fragile companies before they can damage your portfolio. Its ~400-holding diversification spreads risk across the entire quality dividend universe. And its ~11% annual dividend growth rate means patient investors build extraordinary yield-on-cost over time.
In 2026, with dividend investing staging a comeback against growth stocks, DGRO’s ~25% 1-year total return and continued resilience during volatility make the case stronger than ever. Whether you use DGRO as a SCHD complement, a VOO satellite, or a standalone dividend core, it deserves serious consideration in every long-term portfolio.
Are you already holding DGRO, or are you considering adding it to your portfolio? Leave a comment below and share your strategy. And to compare DGRO with its closest rival in depth, check out our SCHD vs DGRO 2026 head-to-head comparison — or build your complete income plan with our passive income ETF portfolio guide.
FAQs
Q1: Is DGRO a good long-term ETF for dividend growth investing?
A1: Yes — DGRO is one of the most compelling long-term dividend growth ETFs available in 2026. Its four-stage quality screening process (5+ years dividend growth, positive earnings forecast, sub-75% payout ratio, and yield trap exclusion) ensures the fund holds only financially healthy, sustainable dividend payers. Over the past decade, DGRO has grown its dividend at approximately 11% per year — meaning your income on a fixed investment roughly doubles every 7 years through dividend growth alone. Combined with a low 0.08% expense ratio, broad diversification across ~400 holdings, and a beta of ~0.75 (lower volatility than the S&P 500), DGRO is an excellent core or satellite holding for investors with a 15–30-year time horizon. If you are just starting, our beginner investing mistakes guide can help you avoid common pitfalls when building your first dividend portfolio.
Q2: How does DGRO compare to SCHD in 2026, and which one should I buy?
A2: SCHD and DGRO are complementary rather than competing — each excels in different dimensions. SCHD (current yield ~3.4–3.8%, 0.06% fee, ~101 holdings) delivers higher immediate income and has a longer 10-year dividend growth requirement — making it better for investors who need more current cash flow. DGRO (current yield ~2.5%, 0.08% fee, ~400 holdings) provides broader diversification, ~20% Technology exposure absent in SCHD, and a payout ratio filter that SCHD does not apply — making it better for total return compounders and investors wanting sector balance. Both have delivered approximately 11% annual dividend growth over 10 years. The optimal approach for most investors is holding both ETFs — SCHD for income today, DGRO for income growth and diversification — paired with VOO as the primary growth core. Our full SCHD vs DGRO 2026 comparison covers every metric in complete detail.
Q3: Does DGRO pay monthly or quarterly dividends, and is it tax-efficient?
A3: DGRO pays dividends quarterly — not monthly. Distributions are typically paid in March, June, September, and December. While this is less frequent than monthly-paying ETFs like JEPI or JEPQ, DGRO’s dividends are predominantly qualified dividends — taxed at preferential rates of 0%, 15%, or 20% depending on your income bracket, compared to up to 37% for ordinary income dividends from covered call ETFs. This qualified dividend tax treatment makes DGRO particularly efficient to hold in taxable brokerage accounts. For tax-advantaged accounts (Roth IRA, Traditional IRA), DGRO’s dividends grow completely sheltered from annual taxation, allowing the full dividend reinvestment compounding effect to operate without friction. If you want to learn how to structure your dividend income for maximum after-tax efficiency, our guide on how much you need to live off dividends covers the tax planning strategy in full detail.
Financial Disclaimer: This article is intended for educational and informational purposes only. It does not constitute financial, investment, tax, or legal advice. All performance data, yield figures, dividend growth rates, AUM figures, holdings data, and compounding simulations referenced herein are based on publicly available information as of June 2026. Past performance — including dividend growth history and total return figures — does not guarantee future results. Dividend distributions are variable and not guaranteed. Investing in ETFs involves risk, including the potential loss of principal. Expense ratios, holdings, and fund characteristics are subject to change at the discretion of the fund issuer. Tax treatment varies by jurisdiction, account type, and individual financial circumstances. Always conduct thorough personal research and consult a licensed financial advisor and qualified tax professional before making any investment decisions.