You want dividend income — steady, growing, reliable cash flow that builds your wealth while you sleep. So you narrow it down to two of the most popular choices: SCHD and DGRO. Both are dividend ETFs. Both have loyal followings. But they follow completely different strategies, and choosing the wrong one for your goal could mean years of underperformance or income shortfall. In the SCHD vs. DGRO 2026 debate, the differences are sharper than ever — and the right answer depends entirely on what you’re actually trying to build. This guide breaks down every key metric with the latest 2026 data so you can stop guessing and start investing with conviction.
Key Takeaways:
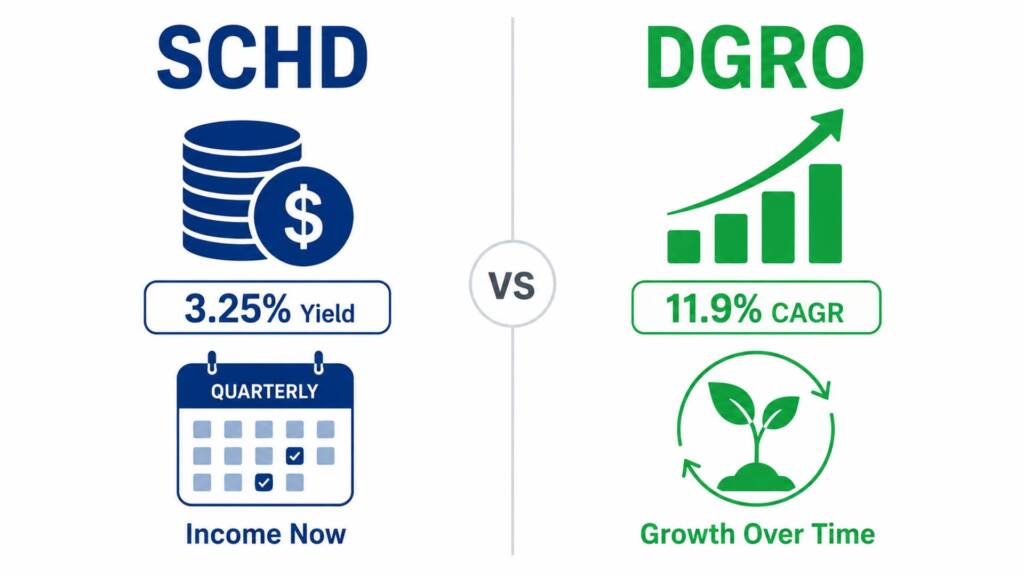
- SCHD delivers a significantly higher current yield of ~3.25% as of June 2026 — paying $0.26/share quarterly — making it the stronger choice for investors who need income today
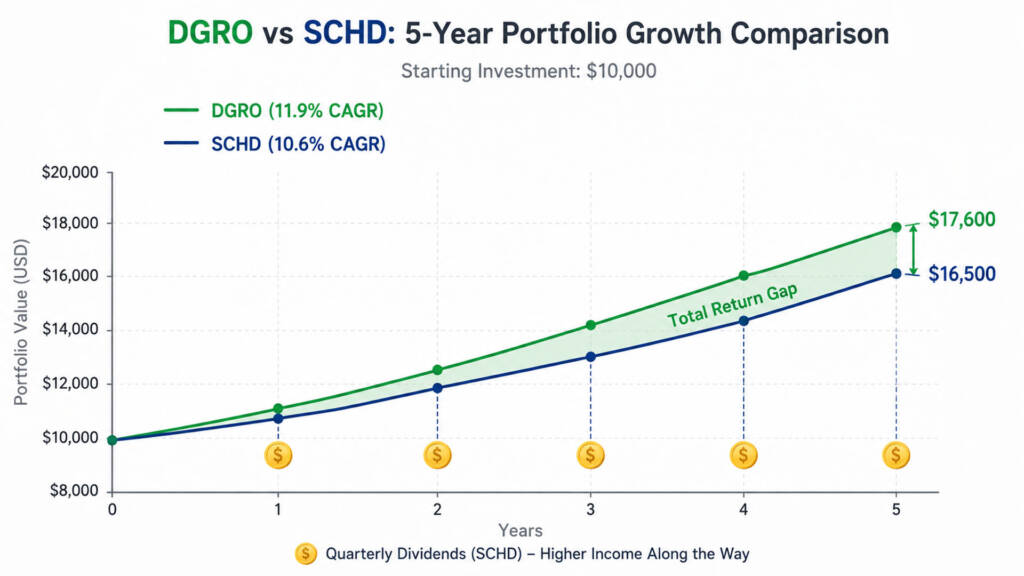
- DGRO has outperformed SCHD on total return over most long-term periods, with a 5-year CAGR of ~11.9% vs. SCHD’s ~10.6% — and a 1-year return of ~16.09% vs. SCHD’s ~13.97% as of mid-2026
- Combining both ETFs in a portfolio gives you the best of both worlds — high current income from SCHD plus superior long-term dividend growth and capital appreciation from DGRO
What Are SCHD and DGRO?
Before comparing them head-to-head, it’s important to understand what each ETF is actually designed to do. They both fall under the “dividend ETF” category — but their investment philosophies are fundamentally different.
SCHD — Schwab U.S. Dividend Equity ETF
SCHD is managed by Charles Schwab and tracks the Dow Jones U.S. Dividend 100 Index. It launched in October 2011 and focuses on high-quality, high-yield dividend payers — companies with strong cash flow, low debt, and a track record of consistent dividend payments. As of June 2026, SCHD trades at approximately $32.50 per share, carries an ultra-low expense ratio of 0.06%, and yields ~3.25% annually. Its Q1 2026 dividend of $0.2569 per share marked a +3.3% year-over-year increase — the largest Q1 payout in the ETF’s history. SCHD selects roughly 100 stocks with strict quality screens, leaning heavily toward financials, healthcare, industrials, and consumer staples.
DGRO — iShares Core Dividend Growth ETF
DGRO is managed by BlackRock’s iShares and tracks the Morningstar US Dividend Growth Index. It launched in June 2014 and focuses specifically on dividend growth — companies that have consistently increased their dividends for at least 5 consecutive years and maintain a payout ratio below 75%. This screen avoids “dividend traps” — stocks with artificially high yields that are unsustainable. As of late May 2026, DGRO trades at approximately $74.94 per share, carries an expense ratio of 0.08%, and currently yields ~2.23%. DGRO holds a broader basket of approximately 420+ stocks, with meaningful exposure to technology, healthcare, financials, and industrials — giving it more growth-oriented diversification than SCHD.
SCHD vs. DGRO 2026: Full Head-to-Head Comparison
Here is a comprehensive, data-driven comparison using the latest figures available as of June 2026:
Dividend Yield vs. Dividend Growth: The Core Tradeoff
This is the most important concept in the entire SCHD vs. DGRO 2026 comparison — and it’s the lens through which every other metric should be viewed.
SCHD: Built for Income Today
SCHD’s strategy prioritizes current income. Its ~3.25% yield as of June 2026 is almost 1.0 percentage point higher than DGRO’s ~2.23% yield. For a $50,000 investment, that translates to approximately $1,625/year from SCHD vs. $1,115/year from DGRO — a difference of $510 annually just in dividends. Over a decade, even without compounding, that gap is $5,100 in additional cash income.
SCHD also rewards its investors with consistent dividend growth. The Q1 2026 payout of $0.2569 represented a +3.3% year-over-year increase, continuing its reputation as a reliable dividend grower. For investors who depend on their portfolio for supplemental income — or who are approaching retirement — SCHD’s higher starting yield is a genuine, tangible advantage. If you’re building a dividend snowball strategy, SCHD’s reinvested dividends compound powerfully at that higher yield.
DGRO: Built for Income Tomorrow
DGRO’s strategy prioritizes dividend sustainability and growth over current yield. Its Morningstar Dividend Growth Index requires a minimum of 5 consecutive years of dividend increases and a payout ratio below 75% — filters that eliminate speculative high-yielders and focus on quality compounders. The 5-year dividend growth rate for DGRO sits at approximately 9.47% — meaning its dividends are growing substantially faster than inflation, and substantially faster than many fixed-income alternatives.
Furthermore, DGRO’s broader inclusion of technology sector dividend payers — companies like Microsoft, Apple, and Broadcom — gives it meaningful exposure to high-growth businesses that are just beginning to scale their dividend programs. These companies currently offer lower yields but are growing their payouts aggressively, positioning DGRO for significantly higher future income generation. This aligns well with the concept of growth vs. dividend investing — DGRO elegantly bridges both worlds.
Total Return Performance: Where DGRO Pulls Ahead
When investors compare dividend ETFs, they often focus exclusively on yield — but total return (price appreciation plus dividends) is the true measure of long-term wealth creation.
Here, DGRO has a consistent edge over SCHD across multiple timeframes:
- 1-Year Total Return (to mid-2026): DGRO ~16.09% vs. SCHD ~13.97%
- 5-Year CAGR: DGRO ~11.9% vs. SCHD ~10.6%
- YTD 2026 (early March): DGRO exceeded +5% vs. SCHD lagging slightly
Why does DGRO outperform on total return despite a lower yield? Primarily because of its technology exposure. SCHD’s strict quality screen historically underweights fast-growing tech companies — which have been major drivers of S&P 500 outperformance over the past decade. DGRO’s broader mandate captures more of that tech growth, resulting in stronger capital appreciation on top of its growing dividends.
However, it’s important to note that past performance does not guarantee future results. In periods of economic stress — such as a rising interest rate environment — SCHD’s more defensive sector composition (financials, consumer staples, healthcare) may provide stronger downside protection. If you want to understand how to think about your portfolio during volatile periods, our article on what to do when the stock market crashes is essential reading.
A Real-World Compounding Simulation
Let’s put real numbers behind this comparison. Assume you invest $10,000 in each ETF and reinvest all dividends, using the historical CAGRs as projected growth rates. These are projected outcomes based on historical data — not guaranteed results.
| Period | SCHD ($10K, 10.6% CAGR) | DGRO ($10K, 11.9% CAGR) | SCHD Annual Income (3.25%) | DGRO Annual Income (2.23%) |
|---|---|---|---|---|
| Year 5 | ~$16,510 | ~$17,580 | ~$537 | ~$392 |
| Year 10 | ~$27,260 | ~$30,870 | ~$886 | ~$688 |
| Year 20 | ~$74,280 | ~$95,270 | ~$2,414 | ~$2,124 |
| Year 30 | ~$202,500 | ~$294,000 | ~$6,581 | ~$6,556 |
The simulation reveals something fascinating: by Year 30, DGRO’s compounding advantage nearly closes the dividend income gap entirely — while also producing a portfolio worth approximately $91,500 more in total value. However, in the early years (0–15), SCHD generates meaningfully more annual income — which matters a great deal if you need cash flow sooner rather than later.
This is exactly why many experienced dividend investors choose to hold both ETFs simultaneously, using SCHD for current income and DGRO for long-term compounding. Consider pairing either ETF alongside a broad market core like VOO — our core and satellite portfolio strategy shows exactly how to structure this approach.
Risk Profile and Volatility
Both SCHD and DGRO are considered low-volatility ETFs relative to the broader market — but there are meaningful differences in their risk profiles:
- SCHD Beta: 0.61 — meaning SCHD moves only 61% as much as the S&P 500 in either direction. This makes it one of the most defensively positioned large ETFs available. In a broad market decline, SCHD’s focus on consumer staples, healthcare, and financials provides a natural cushion.
- DGRO Beta: 0.72 — slightly more volatile than SCHD but still well below the market average. DGRO’s larger tech allocation introduces marginally more sensitivity to market swings, but its dividend growth focus still keeps volatility substantially lower than a pure growth ETF like QQQ.
For risk-averse investors or those approaching retirement, SCHD’s lower beta and higher current yield make it a compelling defensive income vehicle. For investors with a longer time horizon who can absorb short-term volatility in exchange for stronger long-term compounding, DGRO’s slightly higher beta comes with a proportional upside.
Who Should Choose SCHD vs. DGRO?
After reviewing all the data, here is the clearest investor-profile breakdown:
Choose SCHD If You:
- Need higher current dividend income — retirees or semi-retirees who rely on portfolio cash flow
- Prefer a more defensive, low-volatility portfolio with less tech exposure
- Want a lower P/E valuation (19.5x vs. DGRO’s 23.2x) — suggesting better relative value in today’s market
- Are building a dividend snowball strategy and want to maximize reinvested income from day one
- Want to complement a VOO and JEPQ portfolio with a high-quality dividend anchor
Choose DGRO If You:
- Prioritize long-term total return over immediate income
- Want broader diversification across 420+ stocks vs. SCHD’s ~100
- Prefer exposure to technology dividend growers that are rapidly scaling payouts
- Have a 10–30 year investment horizon and want compounding to do the heavy lifting
- Want a dividend ETF that avoids yield traps through its strict 5-year growth and payout ratio screens
Best Approach: Hold Both
The most powerful strategy — and one used by many experienced passive income investors — is to combine SCHD and DGRO in your portfolio. A common allocation is 50% SCHD / 50% DGRO, which gives you a blended yield of approximately ~2.74% while capturing the long-term growth advantages of DGRO and the defensive income of SCHD. This pairing naturally balances current income against future dividend growth, making it resilient across different market environments. If you’re new to building a diversified ETF portfolio, our beginner investor mistakes guide will help you avoid the most common pitfalls before you invest.
For authoritative external research on dividend ETF investing strategies, see Morningstar’s ETF research center for independent fund ratings, sustainability scores, and detailed portfolio analysis.
Conclusion & Call to Action
In the SCHD vs. DGRO 2026 comparison, there is no single “winner” — because the best choice depends entirely on your investment timeline and income needs. If you need income now, SCHD’s 3.25% yield and strong dividend consistency make it the clear choice. If you’re building for the next 20–30 years, DGRO’s superior total return CAGR of 11.9% and faster dividend growth rate position it as the stronger long-term compounder. And if you can hold both — you probably should.
Either way, never forget the power of a broad-market core. Both SCHD and DGRO work best as satellite holdings alongside a low-cost S&P 500 core like VOO. Start with your core, add your dividend layer, and let compounding do the rest. Don’t forget to review how often to rebalance your portfolio to keep your allocation on track as dividends and price movements shift your weights over time.
Which do you prefer — SCHD, DGRO, or both? Drop your answer in the comments below. And if you’re comparing other dividend ETF options, don’t miss our deep-dive on SCHD vs. VYM for another popular income ETF head-to-head.
Frequently Asked Questions
Q1: Is SCHD or DGRO better for retirement income in 2026?
A1: For investors already in or near retirement who need immediate, reliable cash flow, SCHD is the better choice in 2026. Its ~3.25% dividend yield — with a Q1 2026 payout of $0.2569/share (+3.3% YoY) — delivers more income per dollar invested than DGRO’s ~2.23% yield. SCHD’s lower beta of 0.61 also makes it more defensively positioned during market downturns — an important feature for retirees who cannot afford significant drawdowns. For investors still 10–20 years from retirement, DGRO’s superior long-term total return may be more valuable.
Q2: Does DGRO outperform SCHD over the long term?
A2: Yes — based on historical data, DGRO has outperformed SCHD on total return across most measured periods. DGRO’s 5-year CAGR of ~11.9% exceeds SCHD’s ~10.6%, and its 1-year total return of ~16.09% surpasses SCHD’s ~13.97% as of mid-2026. The primary driver is DGRO’s broader technology exposure through companies with growing dividend programs — sectors that have been major S&P 500 outperformers. However, this does not guarantee future outperformance, and SCHD’s defensive positioning may provide superior downside protection in a market downturn.
Q3: Can I hold SCHD and DGRO together in the same portfolio?
A3: Absolutely — and many experienced dividend investors do exactly this. Holding SCHD and DGRO together gives you a blended dividend yield of approximately ~2.74% while combining SCHD’s higher current income with DGRO’s superior dividend growth and total return potential. A common allocation is 50/50 or 60% SCHD / 40% DGRO, depending on your income needs. For best results, pair this dividend combination as a satellite holding alongside a broad-market core ETF like VOO for maximum long-term diversification and compounding efficiency.
Financial Disclaimer: This article is intended for educational and informational purposes only. It does not constitute financial, investment, tax, or legal advice. All performance figures, dividend yields, and projected outcomes are based on historical data and current market conditions as of June 2026, and do not guarantee future results. Dividend payments may be reduced or discontinued at any time. Always consult a licensed financial advisor before making any investment decisions.