

If you hold QQQ, the last two weeks of June 2026 probably felt like a stress test. On June 23, South Korea’s KOSPI plunged so hard it halted trading, Samsung and SK Hynix lost 12% in a single morning, and the Nasdaq sank 2.2% that afternoon. Over the following days the slump went global, and Oracle closed its worst week since the dot-com bubble. Search interest in “ai bubble 2026” exploded — and honestly, the fear is understandable. Your portfolio’s biggest growth engine suddenly looks like its biggest liability. But panic-selling a Nasdaq-100 position based on headlines is how long-term investors turn a paper drawdown into a permanent loss. This article looks at the actual data — valuations, concentration, capex, and history — and gives you a calm, rules-based framework for what to do with QQQ right now.
Key Takeaways:
- The warning signs are real but mixed. Nasdaq-100 valuations sit well above historical medians, yet unlike 1999, today’s tech giants fund AI spending largely from real profits, not debt.
- QQQ is still up roughly 15%–20% YTD as of late June 2026 despite the sell-off — this is a sentiment correction from record highs, not (yet) a crash.
- Your best defense is position sizing, not prediction. Treat QQQ as a satellite around a broad-market core like VOO, and let dollar-cost averaging do the emotional heavy lifting.

What Just Happened? The June 2026 Sell-Off in Plain English
Three forces collided in late June.
First, valuation anxiety hit a breaking point. The Shiller price-to-earnings ratio for the US market exceeded 40 for the first time since the dot-com crash. A CAPE of 40 is above any level seen outside the very peak of the internet bubble, according to GMO’s Jeremy Grantham.
Second, the Fed turned hawkish again. The Fed’s June 2026 projections showed PCE inflation at 3.6% — well above the 2% target — with the federal funds rate projected at 3.8% for the year. Higher rates disproportionately hurt high-growth tech stocks, whose value depends on future cash flows. Transition-wise, this matters because QQQ is essentially a bet on those future cash flows.
Third, the AI spending math started scaring people. Total AI spending is expected to surpass $1.6 trillion between 2026 and 2029, and hyperscaler capex estimates for 2026 alone have swollen from $650 billion to $725 billion, with Moody’s suggesting it could reach $785 billion. Meanwhile, total AI revenue this year is estimated at less than $50 billion against a trillion dollars or more of investment. That gap — massive spending, modest revenue — is the core of the ai bubble 2026 debate.
Big names have picked sides. Michael Burry told subscribers in May 2026 that “the market has jumped the shark” and reportedly holds put options on the semiconductor ETF SOXX through January 2027. Ray Dalio said his bubble indicators show US equities rising close to — though not at — the levels of 2000 and 1929.
The Bull Case: Why This Isn’t 1999 (Yet)
Before you sell everything, hear the other side — because it’s backed by data too.
Fidelity’s early-2026 assessment found that companies have funded AI capex almost entirely from earnings rather than debt, and that valuations, while above historical averages, remain below the extremes of the late-1990s dot-com bubble. They flagged no warning signs like shrinking free cash flows or deteriorating leverage ratios as of early 2026.
The valuation comparison to 2000 is also less extreme than headlines suggest. At one point in 2000, Cisco was priced at over 200 times trailing earnings, while Nvidia trades at less than 50 times today. Furthermore, the S&P 500 appears on track for its 10th consecutive quarter of earnings growth, with analysts expecting a third straight year of double-digit earnings acceleration in 2026. In 1999, profits were a promise. In 2026, they’re on the income statement — the question is whether they can grow fast enough to justify the price.
Reconciling the Conflicting Valuation Numbers
Here’s something most articles skip: sources genuinely disagree on how expensive the Nasdaq-100 is. As of late June 2026, GuruFocus puts the Nasdaq-100 trailing P/E at about 35.3 (versus a median of 24.5), while another data provider (Trendonify) shows roughly 40.8 against a 20-year median of 24.3. Earlier in the year, Siblis Research measured a trailing P/E of 32.3 and a forward P/E of 27.4 as of January 1, 2026.
Why the spread? Three reasons: trailing versus forward earnings, different price snapshot dates during a volatile month, and different methods for aggregating index earnings (some exclude loss-making companies, some don’t). The honest takeaway is a range: the Nasdaq-100 trades at roughly 35x–41x trailing earnings as of June 2026 — expensive by almost any historical measure, but the exact degree depends on methodology. When every methodology says “above median,” the direction matters more than the decimal.
What a Burst Would Actually Do to Your QQQ Position
History gives us a brutal reference point. After the March 2000 peak, QQQ fell 75.85% and didn’t break even in nominal terms until August 2013 — roughly 13 years. Nobody is forecasting a repeat, and QQQ’s 10-year annualized return of about 21.8% as of June 2026 shows what patience earned afterward. But position sizing should assume bad outcomes are possible.
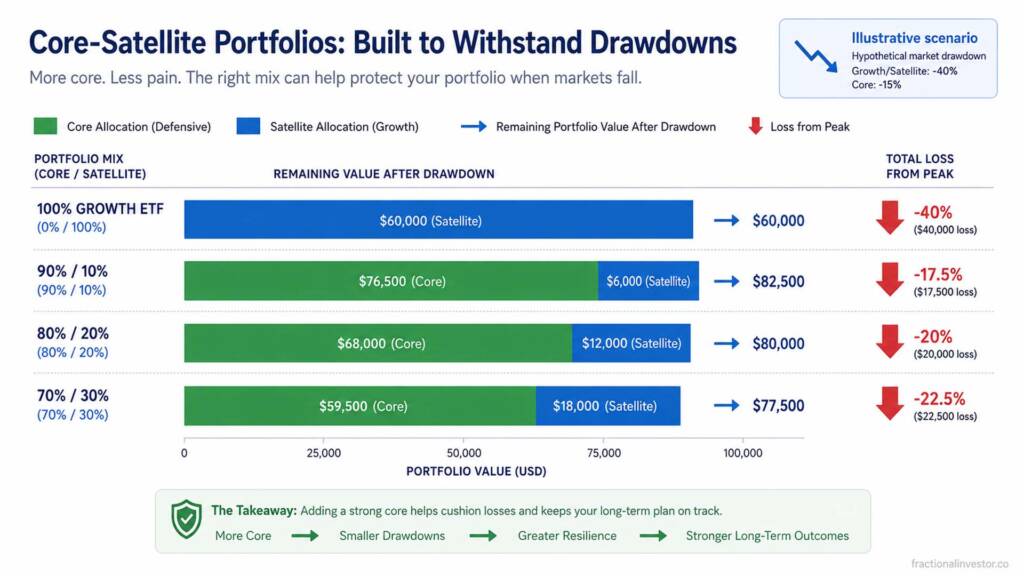
Here’s a hypothetical illustration I built to make the core-and-satellite logic concrete. It assumes a $10,000 portfolio, a hypothetical 30% QQQ drawdown, and a milder 15% drawdown for a broad-market core like VOO (large-cap indexes historically fall less than the Nasdaq-100 in tech-led corrections, though not always). These are illustrative scenarios, not predictions, and past performance does not guarantee future results.
| Portfolio Mix | Value After Hypothetical Drawdown | Loss |
|---|---|---|
| 100% QQQ | $7,000 | –$3,000 (–30.0%) |
| 70% VOO / 30% QQQ | $8,050 | –$1,950 (–19.5%) |
| 80% VOO / 20% QQQ | $8,200 | –$1,800 (–18.0%) |
| 90% VOO / 10% QQQ | $8,350 | –$1,650 (–16.5%) |
The math is simple, but the behavioral impact isn’t. A –30% statement is where most investors capitulate and sell at the bottom. A –18% statement is survivable. The mix you can hold through a crash beats the mix that looks best in a bull market.
One more concentration point QQQ holders should know: just eight companies — Apple, Microsoft, Nvidia, Alphabet, Amazon, Broadcom, Tesla, and Meta — account for around 46% of the Nasdaq-100’s total weight. Buying QQQ is not buying 100 diversified stocks. It’s buying eight giants with 92 passengers.
The 4-Step Plan: What QQQ Investors Should Do Now
Step 1: Check your actual damage — it’s smaller than the headlines. Despite the June turmoil, QQQ’s year-to-date total return was still roughly +15.2% as of June 26, per YTDreturn.com, and about +20.2% through June 30 with dividends reinvested, per Total Real Returns — the gap reflects a sharp rebound in the final trading days of the month. QQQ sat only about 1.2% below its all-time total-return high as of June 30. Call it +15%–20% YTD as of end-June 2026. That is not what a burst bubble looks like. It’s what volatility near record highs looks like.
Step 2: Fix your allocation, not your prediction. If QQQ (or QQQ plus overlapping tech positions) exceeds 20%–30% of your portfolio, the June scare was your rehearsal. Trim toward a broad core like VOO on strength, not in a panic. Our core-and-satellite portfolio guide walks through exactly how to size satellites.
Step 3: Keep dollar-cost averaging — it’s built for exactly this. DCA into your core automatically buys more shares when prices drop. It removes the impossible task of timing a bubble top. If you’re deciding between the Nasdaq-100 and the S&P 500 for new money, our QQQ vs VOO comparison breaks down the trade-off.
Step 4: Write your crash rules before you need them. Decide now: at what drawdown do you rebalance? What would make you sell (a fundamental thesis break, not a red month)? Investors without rules improvise, and improvisation under stress usually means selling low. Our guide on what to do when the stock market crashes is worth bookmarking before you need it.
If you don’t yet have a brokerage that offers fractional shares and low-cost access to US ETFs, Interactive Brokers is what I use for exactly this kind of DCA setup. Disclosure: this is an affiliate link; we may earn a commission at no cost to you.
Risks & Limitations
Be clear-eyed about what QQQ exposure means in this environment:
Concentration risk. With roughly 46% of the index in eight mega-cap names, QQQ offers what Apollo’s chief economist has called a “diversification illusion”. An AI-specific shock hits nearly half the fund at once.
Valuation risk. At roughly 35x–41x trailing earnings (June 2026, sources above), the index prices in years of strong earnings growth. Analysts have historically predicted about 13% annual S&P 500 earnings growth while realized growth was closer to 7% — disappointment is the historical norm.
Interest-rate risk. With PCE inflation at 3.6% and the Fed projecting a 3.8% funds rate, further hawkish surprises would pressure growth valuations most.
Deep-drawdown risk. The dot-com precedent — a 75.85% fall and 13-year recovery — is extreme, but it happened to this exact index. Size positions accordingly.
Distributions won’t cushion you. QQQ yields only about 0.4%–0.5%; this is a capital-appreciation vehicle with minimal income buffer. Its expense ratio is 0.18%, per Invesco/Yahoo Finance as of June 2026.
Conclusion & Call to Action
So, is the AI bubble about to burst? The honest answer: the ingredients of a bubble are visible — stretched valuations, historic concentration, and a trillion-dollar capex bet with uncertain returns. But the ingredients of 1999’s collapse — debt-fueled spending and profitless companies — are largely absent so far. That means your job isn’t to predict the pop. It’s to build a portfolio where the pop, if it comes, is survivable: broad-market core, right-sized QQQ satellite, automatic DCA, and pre-written rules.
How are you handling your tech exposure right now — holding, trimming, or buying the dip? Tell me in the comments. And if the June volatility rattled you, read our guide on what to do when the stock market crashes next.
FAQs
Q1: Should I sell all my QQQ before the AI bubble bursts in 2026?
History argues against all-or-nothing moves. Nobody reliably times bubble tops — even Michael Burry’s short positions have specific expiry dates, which shows how uncertain timing is. A better approach is reducing QQQ to a satellite position (10%–30%) around a broad core, so you keep upside if the bull market continues while capping damage if it doesn’t.
Q2: Is QQQ safer than individual AI stocks like Nvidia or Micron during a correction?
Generally yes, but less than you’d think. QQQ spreads risk across 100 companies, so a single-company blowup hurts less. However, because about 46% of the index sits in eight mega-cap tech names, a broad AI sell-off still hits QQQ hard — as June 2026 demonstrated. It reduces company-specific risk, not theme risk.
Q3: What happened the last time the Nasdaq-100 was in a real bubble?
After peaking in March 2000, QQQ fell about 75.85% and took roughly 13 years to recover its nominal peak (August 2013). Investors who kept buying through the decline recovered far sooner than those who bought only at the top — one of the strongest historical arguments for dollar-cost averaging.
Sources
- Fidelity — “Is AI a bubble? 5 signs to watch for” (Feb 2026): https://www.fidelity.com/learning-center/trading-investing/ai-bubble
- Fortune — “Is the AI boom a bubble waiting to pop?” (Jan 2026): https://fortune.com/2026/01/04/is-ai-boom-bubble-pop-tech-stocks-sp500-bull-run/
- Fortune — “‘Yet another way in which 2026 is looking like 1999′” (Jun 2026): https://fortune.com/2026/06/08/ai-boom-tech-stocks-bubble-fears-earnings-growth-chipmakers-ipo/
- NPR — “Is AI ‘one big bubble’? Behind the tech sell-off” (Jun 2026): https://www.npr.org/2026/06/23/nx-s1-5867633/ai-selloff-tech-stocks-bubble-nasdaq
- GMO / Jeremy Grantham — “Valuing AI: Extreme Bubble, New Golden Era, or Both”: https://www.gmo.com/americas/research-library/valuing-ai-extreme-bubble-new-golden-era-or-both_viewpoints/
- Yahoo Finance — QQQ quote & profile: https://finance.yahoo.com/quote/QQQ/
- Total Real Returns — QQQ total return data: https://totalrealreturns.com/n/QQQ
- YTDreturn.com — QQQ YTD return: https://www.ytdreturn.com/qqq/
- InvestSnips — QQQ performance & dot-com drawdown history: https://investsnips.com/qqq-performance/
- GuruFocus — Nasdaq 100 P/E ratio: https://www.gurufocus.com/economic_indicators/6778/nasdaq-100-pe-ratio
- Trendonify — Nasdaq 100 P/E ratio: https://trendonify.com/united-states/stock-market/nasdaq-100/pe-ratio
- Siblis Research — Nasdaq 100 P/E & earnings: https://siblisresearch.com/data/nasdaq-100-pe-ratio/
- MarketWise — AI bubble analysis (capex estimates, Burry positioning): https://marketwise.com/investing/ai-bubble-stock-market-crash-redline-signal/
- Wikipedia — AI bubble (June 2026 sell-off timeline): https://en.wikipedia.org/wiki/AI_bubble
Financial Disclaimer: This article is for educational purposes only and does not constitute financial advice. All data is accurate as of the dates cited but markets change quickly. Past performance does not guarantee future results. Consult a licensed financial advisor before making investment decisions.
