You opened your brokerage account, ready to build long-term wealth. Then the ETF choices hit you — QQQ, VOO, and a dozen others. You wonder: should I go all-in on tech stocks, or keep it broad? This decision could be worth tens of thousands of dollars over your investing lifetime. Get it wrong, and you might chase returns at the worst possible time. Get it right, and you build a portfolio that compounds steadily toward financial freedom. In this guide, we break down the QQQ vs VOO debate with real 2026 data so you can invest with clarity and confidence.
Key Takeaways:
- VOO tracks the S&P 500 with broad diversification and a rock-bottom 0.03% expense ratio, making it the ideal core holding for most investors
- QQQ tracks the Nasdaq-100 and concentrates over 60% of its weight in technology stocks, delivering higher historical returns but with greater volatility
- A “core-and-satellite” blended approach — holding VOO as your foundation and adding QQQ as a growth tilt — is a balanced strategy that many intermediate investors use
What Is QQQ?
The Invesco QQQ Trust (QQQ) is one of the most actively traded ETFs in the world. It tracks the Nasdaq-100 Index, which holds 100 of the largest non-financial companies listed on the Nasdaq exchange. As of 2026, QQQ manages approximately $468 billion in assets and carries an expense ratio of 0.18%. Technology stocks dominate the fund, making up around 60% of its total weight.
The top holdings as of early 2026 include familiar names:
- Nvidia (NVDA): ~8.9% of the fund
- Apple (AAPL): ~7.2%
- Microsoft (MSFT): ~5.0%
- Amazon (AMZN): ~4.7%
- Alphabet (GOOGL/GOOG): ~7.2% combined
QQQ’s top 10 holdings together account for roughly 47% of the entire fund. This concentration is precisely what drives its high return potential — and its elevated risk.
QQQ’s Historical Performance
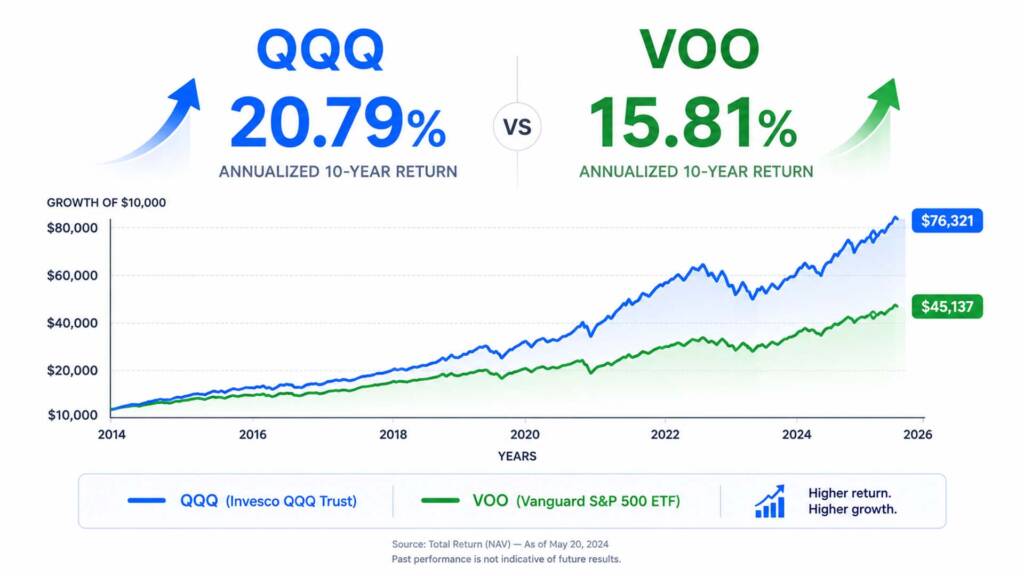
QQQ has delivered an impressive 20.79% annualized return over the past 10 years, making it one of the strongest-performing broad ETFs in history. Over the past 12 months through mid-2026, QQQ returned 14.51%. However, its year-to-date 2026 return stands at -2.02%, a reminder that tech stocks can pull back sharply when sentiment shifts. Past performance, of course, does not guarantee future results.
What Is VOO?
The Vanguard S&P 500 ETF (VOO) tracks the S&P 500 Index — 500 of the largest publicly traded companies in the United States. It is one of the most cost-effective ETFs available today, with an ultra-low expense ratio of just 0.03%. As of April 30, 2026, VOO manages a staggering $927.8 billion in net assets, reflecting its status as a cornerstone of millions of retirement and brokerage accounts.
VOO’s diversification is its defining strength. While it also holds tech giants like Nvidia and Apple, it spreads risk across sectors including healthcare, financials, industrials, consumer staples, and energy. No single company dominates VOO the way tech dominates QQQ. New to ETFs? Read our beginner’s guide on what ETF investing is before going deeper into comparisons.
VOO’s Historical Performance
VOO delivered a 15.81% annualized return over the past 10 years, slightly trailing QQQ but with noticeably lower volatility. Over the past year, VOO returned 14.38% — nearly matching QQQ’s 1-year performance. Its year-to-date 2026 return is -0.04%, far more stable than QQQ’s -2.02% pullback. For long-term investors, this relative stability is extremely valuable.
QQQ vs. VOO: A Side-by-Side Breakdown
Here is how the two ETFs compare across the most important dimensions:
The table makes clear that QQQ is the higher-octane vehicle. However, that performance premium comes with a 6x higher expense ratio and significantly more concentration risk.
The Risk Question: What “Overweighting Tech” Really Means
When you invest in QQQ, you are making a deliberate bet that technology and AI-driven companies will continue to outperform the broader economy. That bet has paid off handsomely over the past decade. But it is not without danger.
Consider what happened during the 2022 tech selloff. The Nasdaq-100 dropped over 33% in a single year, far outpacing the S&P 500’s ~19% drawdown. Investors who held only QQQ saw their portfolios nearly cut in a third. Those who held VOO or a mix of both experienced a much smoother ride. Concentration risk is real, and tech cycles can be brutal.
The Overlap Problem
Here’s something many investors don’t realize. According to Morningstar, only about 4% of QQQ’s holdings (by asset weight) are NOT also present in VOO. That means if you hold both QQQ and VOO in equal parts, you are not doubling your diversification — you are mostly doubling your tech exposure. The correlation between the two funds over recent years has been 0.88, meaning they move together most of the time.
This overlap raises an important question: is it worth paying 0.18% when VOO already gives you significant tech exposure at just 0.03%?
The Case FOR Overweighting Tech With QQQ
Despite the risks, there are legitimate reasons to give QQQ a meaningful allocation in your portfolio — especially if you are in a growth-oriented phase of life.
- AI and technology remain the primary drivers of S&P 500 earnings growth in 2026
- Historical 10-year outperformance of QQQ (20.79%) vs. VOO (15.81%) is significant over long time horizons
- QQQ provides targeted exposure to companies like Nvidia, which is leading the artificial intelligence hardware revolution
- For younger investors with 20+ year time horizons, higher volatility is tolerable in exchange for potential higher returns
- QQQ is ideal as a satellite position — a growth tilt layered on top of a diversified core
Interested in understanding how growth-focused ETFs compare to dividend-focused ones? Check out our in-depth guide on growth vs. dividend investing.
The Case FOR Staying with VOO as Your Core
The math strongly favors VOO as the foundational holding for most investors. Here’s why.
First, cost matters enormously over time. On a $100,000 portfolio, a 0.15% annual difference in fees equals $150 per year — money that compounds in your favor with VOO. Over 30 years, this difference can accumulate to thousands of dollars in additional wealth. Second, the S&P 500’s broad diversification naturally reduces the damage from any single sector’s downturn. Third, VOO’s dividend yield of 1.13% provides modest but reliable income that you can reinvest for the compounding snowball effect. You can read more about this principle in our dividend snowball effect guide.
We’ve also written a dedicated article on why VOO is an excellent ETF core portfolio choice worth reading alongside this one.
Compounding Simulation: $500/Month in QQQ vs. VOO
Let’s make this concrete. Assume you invest $500 per month using dollar-cost averaging for 20 years. We use QQQ’s 10-year historical annualized return of 20.79% and VOO’s 15.81% as reference points (these are historical figures only; future returns may differ).
| Scenario | Monthly Investment | Est. Annual Return | 20-Year Projected Value |
|---|---|---|---|
| 100% VOO | $500 | 15.81% | ~$756,000 |
| 100% QQQ | $500 | 20.79% | ~$1,590,000 |
| 70% VOO / 30% QQQ | $500 | ~17.5% (blended) | ~$950,000 |
These numbers illustrate why the blended approach is so appealing. You still benefit significantly from QQQ’s growth potential. However, you do not take on the full concentration risk of an all-tech portfolio. These are projected outcomes based on historical returns — not guaranteed results. Learn the mechanics of consistent investing with our dollar-cost averaging explained guide.
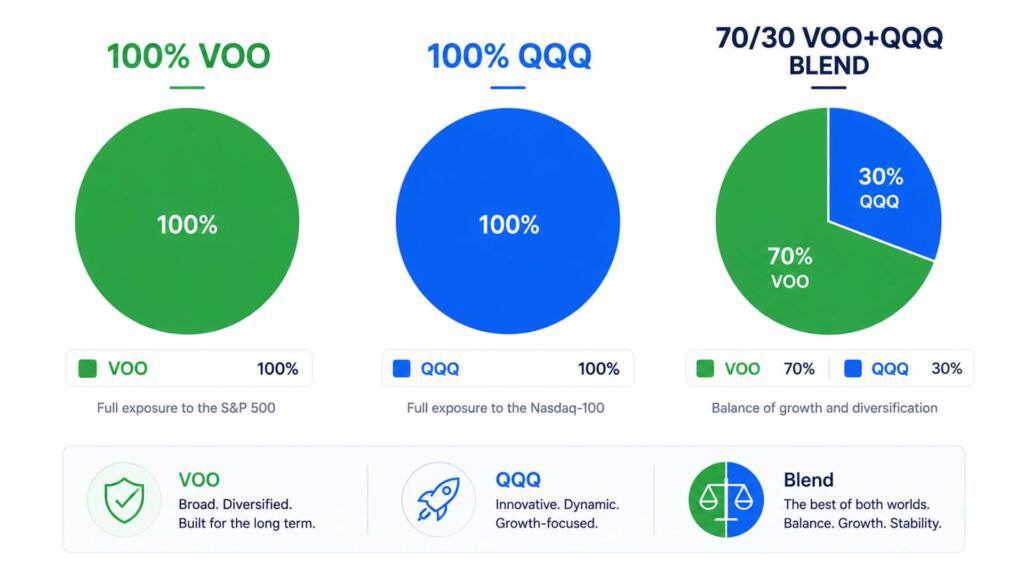
The Core-and-Satellite Strategy: Best of Both Worlds
The most popular and practical approach for intermediate investors is the core-and-satellite portfolio model. VOO serves as your core — the stable, low-cost, diversified foundation (60–80% of your portfolio). QQQ becomes your satellite — a targeted growth position (10–30%) that adds extra tech exposure without derailing your overall diversification. For a deeper breakdown of this approach, read our dedicated post on the core-and-satellite portfolio strategy.
For example, a 70% VOO / 30% QQQ split gives you:
- Broad S&P 500 exposure via VOO
- An additional tech tilt that amplifies performance when Nasdaq leads
- A blended expense ratio of approximately 0.075% — still extremely cost-effective
- Reduced single-sector risk compared to going 100% QQQ
This is the same structure explored in our VOO and JEPQ portfolio article, where income generation is added to the mix.
Common Mistakes to Avoid
Many investors make errors when deciding between QQQ and VOO. Here are the most important ones to sidestep:
- Chasing past performance: QQQ’s dazzling 10-year returns tempt investors to go all-in at market peaks
- Ignoring fees: A 0.15% fee difference seems small but compounds dramatically over decades
- Holding both at equal weight: As Morningstar confirms, this creates redundancy rather than true diversification
- Abandoning VOO during corrections: Volatility is normal; panic-selling locks in losses permanently
- Underweighting your time horizon: QQQ suits long-term investors; short-term traders face bigger drawdown risks
For a full breakdown of the pitfalls to avoid, especially as a newer investor, see our guide on beginner investor mistakes.
Who Should Buy QQQ, VOO, or Both?
Choose VOO if you:
- Are a beginner or early-stage investor [External Link: Vanguard.com — VOO Fund Details]
- Want the lowest cost, most diversified U.S. equity exposure
- Prioritize capital preservation alongside growth
- Are building a retirement or long-term wealth account
Choose QQQ if you:
- Have a long time horizon (15+ years) and high risk tolerance
- Strongly believe in the continued dominance of AI and tech
- Want to add a growth-focused satellite to an existing VOO core
- Are comfortable with sharp short-term drawdowns
Hold both if you:
- Want diversification with a growth tilt
- Are an intermediate investor who understands concentration risk
- Are following a core-and-satellite strategy
Conclusion & Call to Action
The QQQ vs VOO debate does not have one universal answer. For most investors — especially beginners — VOO is the clear starting point. Its ultra-low cost, S&P 500 breadth, and proven long-term track record make it the most reliable core holding available today. QQQ, meanwhile, is a powerful growth tool — but only when used intentionally as part of a broader, balanced portfolio. The best approach in 2026 is likely a blend: VOO as your foundation, with QQQ as a calculated, disciplined satellite position. Avoid the mistake of overweighting tech purely because of past returns. Build your portfolio for the next 20 years — not the last 10.
What’s your current allocation between VOO and QQQ? Drop a comment below — we’d love to hear your strategy. And if you’re comparing other ETFs, check out our head-to-head breakdown of SCHD vs. VYM for dividend-focused options.
Frequently Asked Questions
Q1: Is QQQ better than VOO for long-term growth investing?
QQQ has delivered a higher 10-year annualized return of 20.79% compared to VOO’s 15.81%. However, QQQ concentrates over 60% of its weight in technology stocks, making it significantly more volatile. For long-term investors with high risk tolerance, QQQ can enhance returns. For most people building wealth steadily, VOO’s diversification and near-zero cost make it the more reliable long-term choice.
Q2: Can I hold both QQQ and VOO in my portfolio at the same time?
Yes — and many investors do. However, be aware that roughly 96% of QQQ’s holdings by weight already appear in VOO. Holding both at equal allocations primarily amplifies your tech sector concentration rather than providing genuine diversification. A strategic approach is to use VOO as your core (60–80%) and QQQ as a smaller satellite growth position (10–30%).
Q3: What is the expense ratio difference between QQQ and VOO, and does it matter?
VOO charges just 0.03% per year, while QQQ charges 0.18%. That 0.15% difference may seem trivial, but on a $200,000 portfolio it equals $300 annually. Compounded over 30 years, this gap translates to thousands of dollars in additional wealth. The lower the fee, the more of your returns stay in your pocket — which is why cost is one of the most important factors in long-term ETF selection.
Financial Disclaimer: This article is for educational and informational purposes only. It does not constitute financial advice, a solicitation, or a recommendation to buy or sell any security or investment product. All historical returns mentioned are based on past performance, which does not guarantee future results. Individual financial situations vary. Always consult a licensed financial advisor or registered investment professional before making any investment decisions.