Most ETFs do one of two things: they grow your money, or they pay you a modest dividend. But what if an ETF could do something entirely different — generating 8% to 10%+ in monthly income by systematically selling options on the stocks it already holds? That sounds almost too clever to be true. And for many investors, the mechanics behind it are completely mysterious — until now. Without understanding how covered call ETFs work, you risk chasing extraordinary yields without grasping the real trade-offs baked into the strategy. This guide breaks down the covered call ETF explained concept from the ground up, using the two most popular examples in 2026 — JEPI and JEPQ — with real data, plain-English explanations, and an honest look at who should and shouldn’t own them.
Key Takeaways:
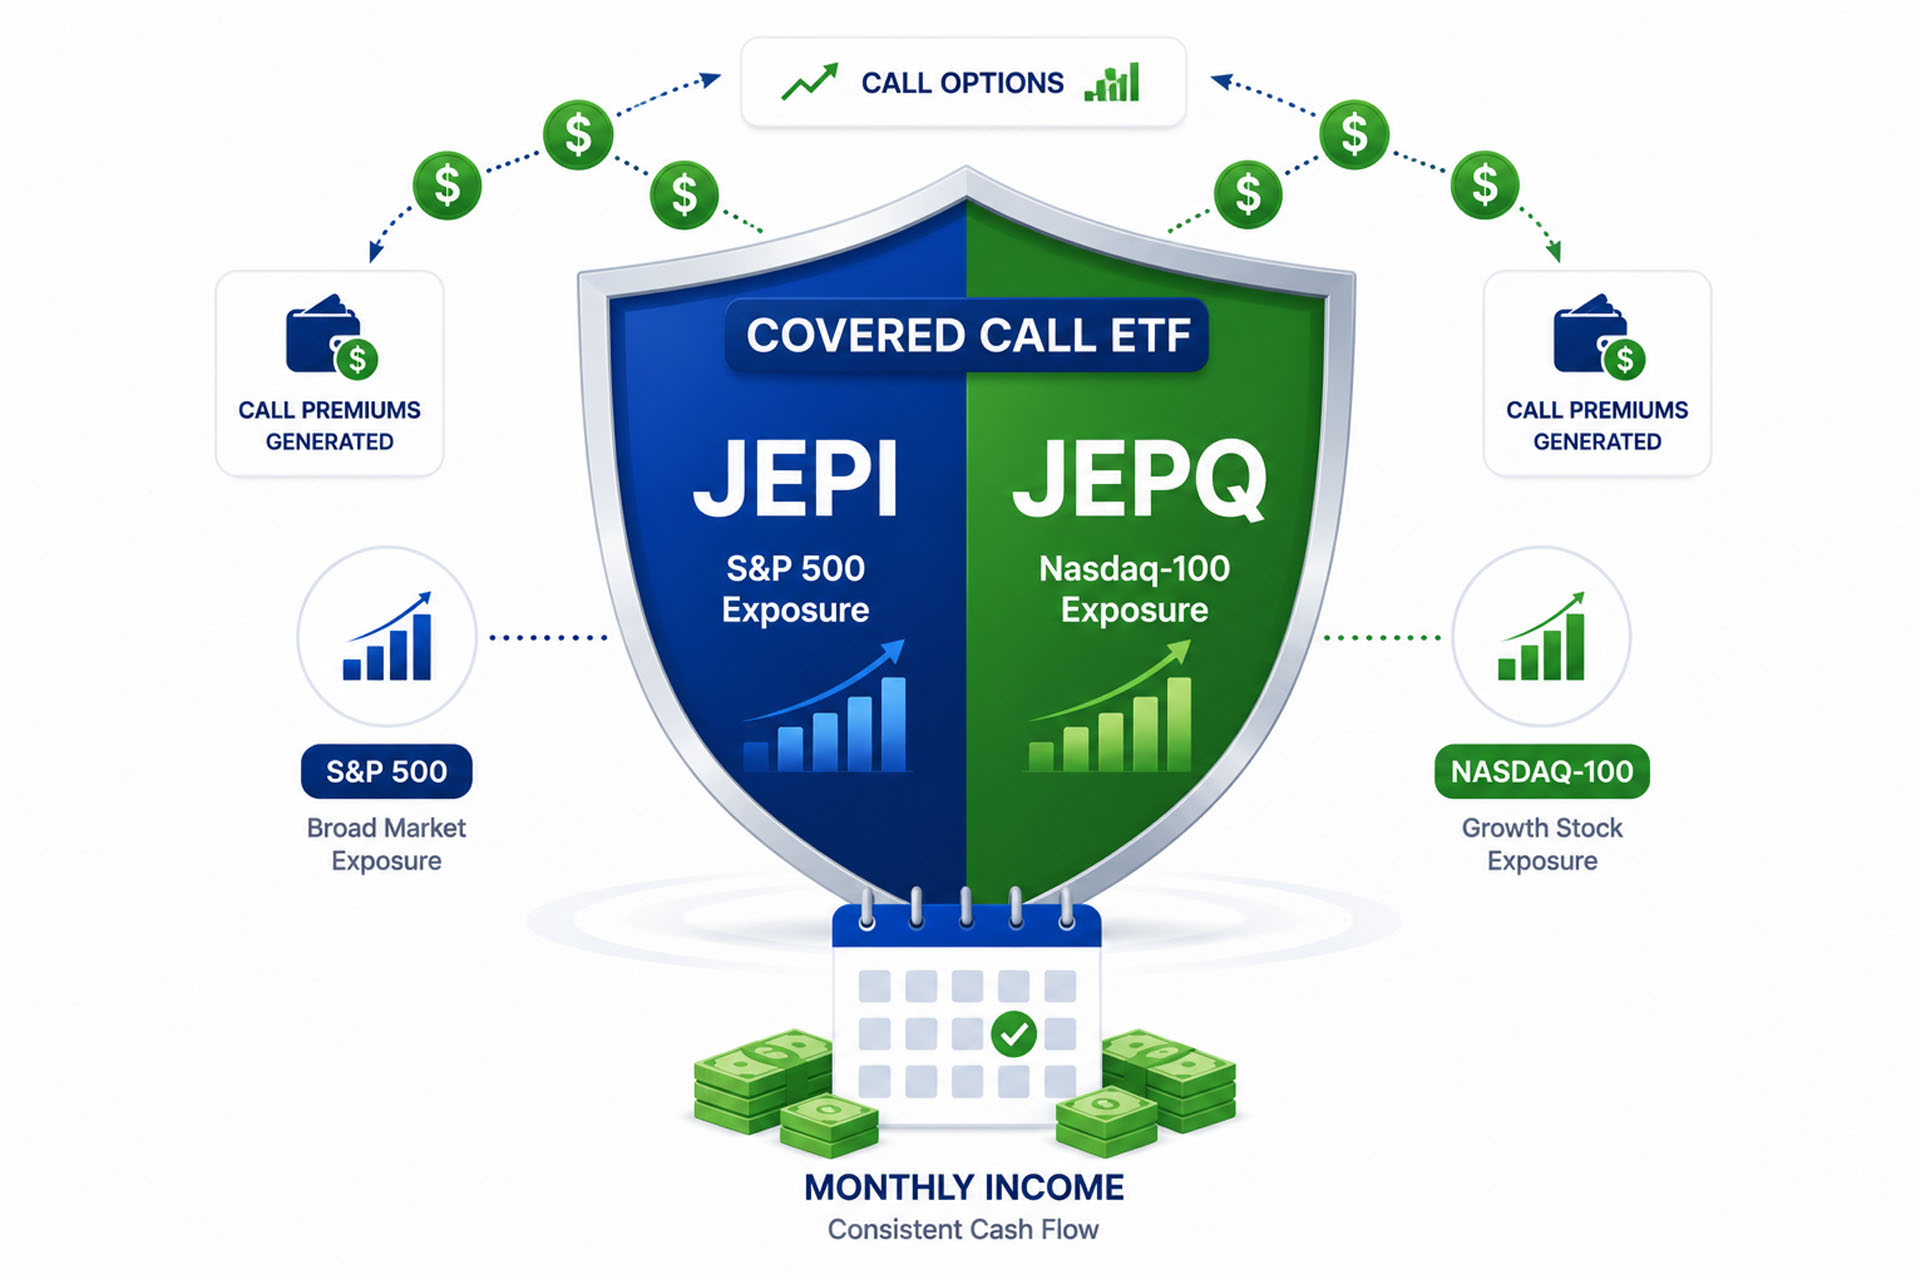
- A covered call ETF generates income by selling (writing) call options on the stocks it holds, collecting option premiums that are distributed to investors as monthly income.
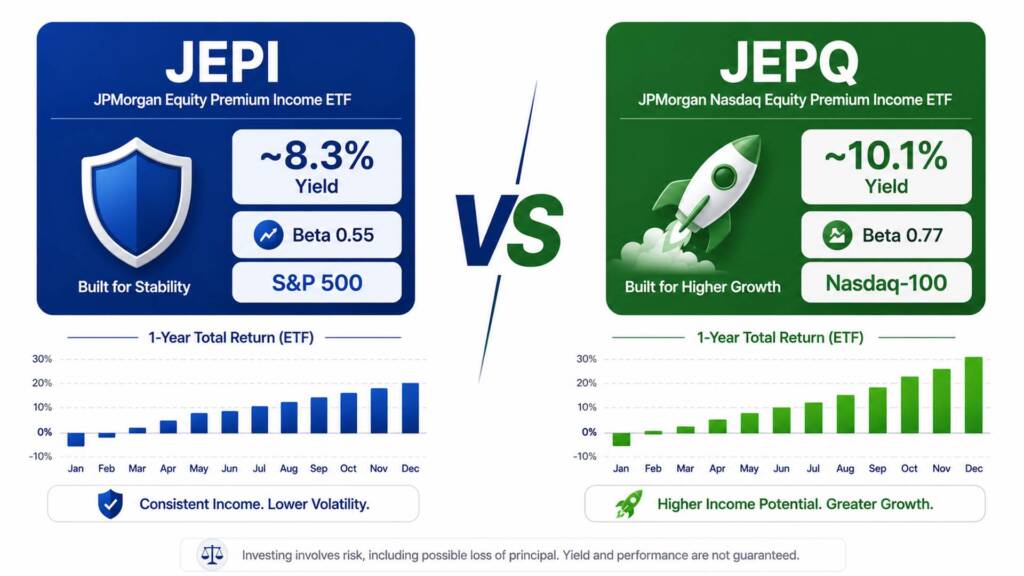
- JEPI (S&P 500 focus, ~8.2–8.5% yield) and JEPQ (Nasdaq-100 focus, ~10.1% yield) are the two largest covered call ETFs in the U.S. market in 2026, with a combined AUM of nearly $90 billion.
- The critical trade-off: covered call ETFs cap your upside in strong bull markets — meaning they will nearly always underperform a pure index ETF like VOO or QQQ during major rallies.
What Is a Covered Call ETF? The Simple Explanation
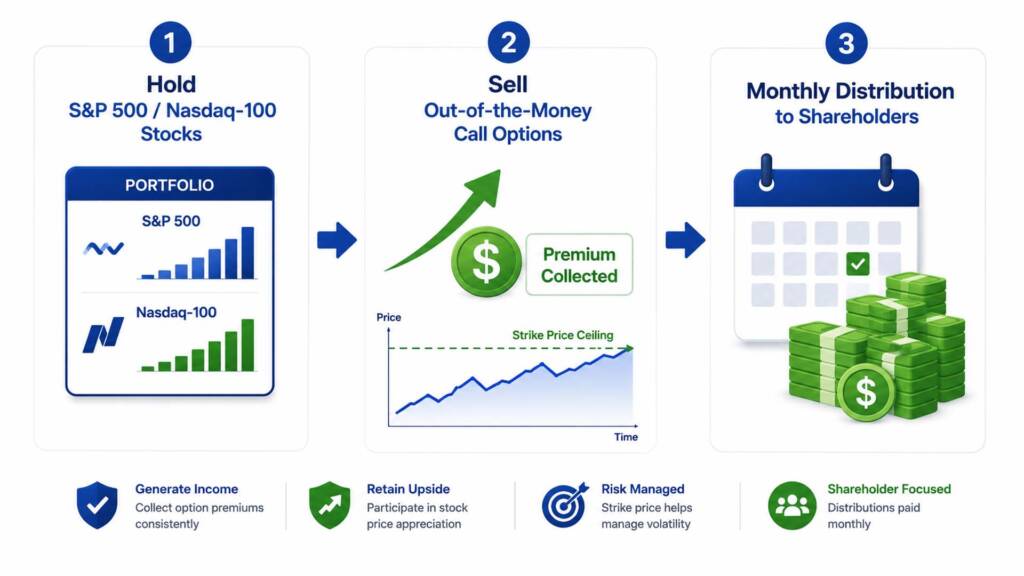
A covered call ETF is an exchange-traded fund that combines two actions simultaneously:
- It holds a portfolio of stocks (such as S&P 500 or Nasdaq-100 companies)
- It sells (writes) call options on those same stocks or an equivalent index — collecting upfront premium payments in exchange
Those option premiums become the primary engine of income. The ETF collects them month after month and passes them along to shareholders as monthly distributions.
Think of it this way. Imagine you own a beach house worth $500,000. You rent it out every summer for $3,000 per month. But you also sign an agreement with a neighbor: “If you pay me $1,500 today, you can buy my house at $550,000 any time in the next 30 days.” You collect the $1,500 immediately. If prices stay flat, you keep the money. If your house suddenly surges to $600,000, though, you’ve capped your gain at $550,000 and lost the extra $50,000 in upside.
That is exactly what a covered call ETF does — at scale, every single month, across hundreds of stocks. The premium is real income. The capped upside is the cost.
Key Options Vocabulary You Need
Before going further, here are the core terms you will encounter:
- Call Option: A contract giving the buyer the right to purchase a stock at a specific price (strike price) before a specific date (expiration)
- Strike Price: The predetermined price at which the option buyer can purchase the stock
- Out-of-the-Money (OTM): When the strike price is above the current stock price — the most common structure used by JEPI and JEPQ
- Option Premium: The upfront cash payment the option seller (the ETF) receives immediately upon writing the contract
- Covered: The ETF already owns the underlying stocks, so the call is “covered” — there is no naked risk of having to buy shares it doesn’t own
- ELN (Equity-Linked Note): A structured note from a bank that gives the ETF economic exposure to the covered call result, without the ETF directly writing exchange-traded options itself — the mechanism JEPI and JEPQ primarily use
How the Covered Call Market Has Exploded in 2026
Covered call ETFs are no longer a niche product. They have become a mainstream force in the ETF industry.
As of early 2026, approximately $170 billion has been allocated to “synthetic income” ETFs — the category that includes covered call strategies like JEPI and JEPQ. An additional $100 billion sits in buffer ETFs, which use options for downside protection. CNBC noted in March 2026 that this is now an “‘overlay everything’ market,” with demand for income-generating ETF structures accelerating across retail investor accounts.
JEPI and JEPQ together represent roughly $88+ billion in combined AUM as of June 2026 — making J.P. Morgan the dominant player in this rapidly growing space. The category’s growth reflects a genuine investor need: in a world of persistent inflation and uncertain equity returns, reliable monthly cash flow has become a priority for millions of Americans.
JEPI Explained: The S&P 500 Income Machine
JEPI — the JPMorgan Equity Premium Income ETF — launched on May 20, 2020, making it the older sibling of the two. It is an actively managed ETF that pursues two parallel goals: generating monthly income and maintaining some exposure to S&P 500 capital appreciation.
How JEPI Generates Its Income
JEPI uses a two-layer strategy:
Layer 1 — Defensive S&P 500 Stock Holdings (~80–85% of portfolio):JEPI does not simply mirror the full S&P 500 by weight. Instead, its portfolio managers actively select roughly 100–120 S&P 500 stocks with a tilt toward lower-volatility, defensive sectors — such as consumer staples, utilities, healthcare, and financials. Top holdings in 2026 include companies like NVIDIA (~2.89%), Visa (~1.5%), and other quality large-caps.
Layer 2 — Equity-Linked Notes (ELNs) (~15–20% of portfolio):Rather than writing exchange-traded call options directly, JEPI purchases Equity-Linked Notes — structured notes issued by major investment banks including JPMorgan itself, Goldman Sachs, Citigroup, and Royal Bank of Canada. These notes are engineered to deliver the economic outcome of holding a stock while simultaneously writing a call option against it. The ELN issuer pockets the hedging mechanics; JEPI pockets the premium income.
This ELN structure means JEPI holders are, in a subtle but important sense, also senior unsecured creditors of the issuing banks. If an ELN issuer were to face a credit crisis, those notes could lose value even if the underlying stocks perform well. This is a low-probability risk but one worth understanding.
JEPI Key Data — June 2026
| Attribute | JEPI |
|---|---|
| Full Name | JPMorgan Equity Premium Income ETF |
| Inception Date | May 20, 2020 |
| AUM | ~$44.4 Billion |
| Approximate Price | ~$55–$56 |
| Trailing Dividend Yield | ~8.2–8.5% |
| Expense Ratio | 0.35% |
| Distribution Frequency | Monthly |
| Beta (5Y) | 0.55 |
| YTD Total Return (2026) | ~0.05% to -2.49% |
| 1-Year Total Return | ~7.05% |
| 5-Year Total Return | ~10.38% |
| Underlying Focus | S&P 500 stocks (defensive tilt) |
JEPI’s beta of just 0.55 makes it the lower-volatility option of the two — it moves roughly half as much as the S&P 500 in both directions. However, its YTD 2026 total return of approximately 0% to -2.5% underscores the core trade-off: in a year where the S&P 500 has climbed, JEPI’s capped upside has meant near-flat capital performance.
JEPQ Explained: The Nasdaq-100 Income Machine
JEPQ — the JPMorgan Nasdaq Equity Premium Income ETF — launched on May 3, 2022 as JEPI’s tech-focused sibling. It applies the same covered call / ELN income strategy, but uses Nasdaq-100 stocks as its foundation — giving it higher income potential, higher volatility, and greater growth exposure than JEPI.
How JEPQ Differs From JEPI
JEPQ’s Nasdaq-100 holdings include the world’s largest tech companies: NVIDIA (~7.78%), Apple (~6.76%), and Microsoft (~6.25%) as leading positions. Because Nasdaq-100 stocks carry higher implied volatility than S&P 500 defensives, the option premiums JEPQ collects are significantly larger — translating into a higher yield (currently ~10.1% vs. JEPI’s ~8.2%).
However, this higher income comes with higher volatility. JEPQ’s beta is approximately 0.77 — still lower than QQQ’s ~1.0+, but meaningfully more volatile than JEPI’s 0.55. In the sharp sell-offs of April 2025 and March 2026, JEPQ fell nearly as much as QQQ itself because sudden crashes happen too quickly for option premiums to offset the losses.
JEPQ Key Data — June 2026
| Attribute | JEPQ |
|---|---|
| Full Name | JPMorgan Nasdaq Equity Premium Income ETF |
| Inception Date | May 3, 2022 |
| AUM | ~$39–$40 Billion |
| Approximate Price | ~$59–$60 |
| Trailing Dividend Yield | ~10.1% |
| 30-Day SEC Yield | ~12.7% |
| Expense Ratio | 0.35% |
| Distribution Frequency | Monthly |
| Beta (5Y) | 0.77 |
| YTD Total Return (2026) | ~6.1–9.2% |
| 1-Year Total Return | ~21.73% |
| Inception-to-Date Annualized | ~17.09% |
| Underlying Focus | Nasdaq-100 stocks (tech-heavy) |
JEPI vs JEPQ: Side-by-Side Comparison
| Feature | JEPI | JEPQ |
|---|---|---|
| Underlying Index | S&P 500 (defensive tilt) | Nasdaq-100 (tech-heavy) |
| Inception Date | May 2020 | May 2022 |
| AUM | ~$44.4B | ~$39–$40B |
| Price | ~$55–$56 | ~$59–$60 |
| Trailing Yield | ~8.2–8.5% | ~10.1% |
| Expense Ratio | 0.35% | 0.35% |
| Beta | 0.55 | 0.77 |
| YTD Return (2026) | ~0% to -2.5% | ~6.1–9.2% |
| 1-Year Total Return | ~7.05% | ~21.73% |
| Monthly Distributions | ✅ Yes | ✅ Yes |
| ELN Structure | ✅ Yes (~15–20%) | ✅ Yes (~15%) |
| Best For | Lower volatility income | Higher income + some tech growth |
The clearest takeaway: JEPI is the conservative option, prioritizing stability and consistent income with lower volatility. JEPQ is the aggressive option, offering higher income and more participation in Nasdaq-100 growth — but with meaningfully more risk and wider price swings.
For a deep-dive comparison of JEPI versus JEPQ head-to-head, our dedicated JEPI vs JEPQ analysis covers every metric in detail. And if you want the full JEPQ story, our comprehensive JEPQ ETF Review 2026 is the complete resource.
The Upside Cap: The Most Important Trade-Off
The single most critical concept in understanding covered call ETFs is the upside cap.
When JEPI or JEPQ sells a call option with a strike price of, say, 3% above the current index level, they are effectively saying: “We will collect this premium, but if the market rallies more than 3% before expiration, we give up every dollar of gain above that level.”
In practical terms:
- In 2025, the S&P 500 delivered exceptional total returns. JEPI’s 1-year total return fell short of half SPY’s return over the same period.
- In the 1-year period ending June 2026, QQQ returned approximately 30.52% while JEPQ returned 21.73% — a ~9-percentage-point performance gap, paid for in the form of JEPQ’s monthly income checks.
- During the March 2026 market pullback, however, JEPQ’s lower beta provided only modest cushioning because the sell-off was too sudden for option premiums to offset losses.
This reveals an important truth: covered call ETFs protect moderately in slow declines but are largely exposed in fast crashes. They shine in sideways and mildly volatile markets — the exact conditions where regular index ETFs grind forward without generating much income.
Tax Considerations: A Critical Factor
The tax treatment of JEPI and JEPQ distributions is one of the most overlooked — and most impactful — aspects for investors.
Most JEPI and JEPQ distributions are taxed as ordinary income, not as qualified dividends. This means they are subject to your full marginal tax rate — potentially as high as 37% for high earners — compared to the preferential 15–20% rate for qualified dividends.
The practical implication is stark. At a 32% marginal tax rate, a 10% JEPQ yield effectively becomes approximately 6.8% after federal taxes in a taxable account. That is still meaningful income — but notably less than the headline figure suggests.
The solution is straightforward: hold JEPI and JEPQ inside tax-advantaged accounts whenever possible. In a Roth IRA, every dollar of monthly income grows completely tax-free. In a Traditional IRA, taxes are deferred until withdrawal. Investors in certain international jurisdictions — such as Singapore, which has no capital gains tax — may also hold structural advantages when owning these ETFs.
How to Use Covered Call ETFs in Your Portfolio
Covered call ETFs work best in a specific role: as income satellites in a broader, diversified portfolio — not as standalone core holdings.
Here is the framework most financial educators recommend in 2026:
The Core-and-Satellite Model:
- Core (70–80%): A broad-market index ETF like VOO (S&P 500) providing stable, uncapped long-term growth
- Satellite (10–20%): JEPI or JEPQ for monthly income generation
- Remaining allocation: Dividend growth ETFs (SCHD, VIG), international equities, or bond ETFs
This structure gives you the best of both worlds: full participation in long-term market compounding through VOO, plus monthly cash flow from the covered call satellite. Our guides on building a VOO and JEPQ portfolio and the core-and-satellite portfolio strategy walk through this exact approach with real allocation examples.
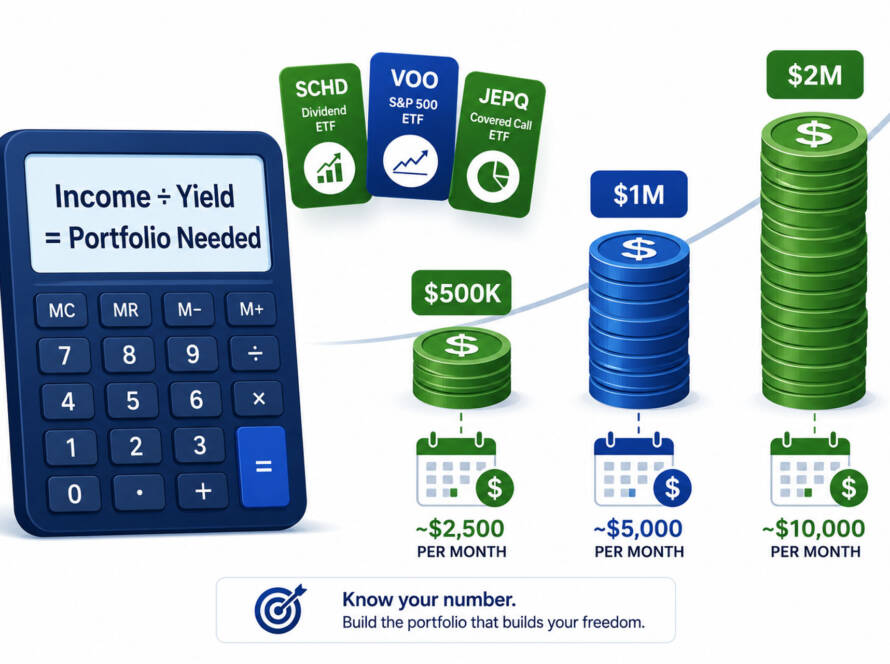
A $500/Month Income Simulation
Based on current data, here is what a $50,000 combined allocation (70% VOO / 20% JEPQ / 10% JEPI) would generate in annual income:
| Holding | Allocation | Yield | Est. Annual Income |
|---|---|---|---|
| VOO (70%) | $35,000 | ~1.3% | ~$455 |
| JEPQ (20%) | $10,000 | ~10.1% | ~$1,010 |
| JEPI (10%) | $5,000 | ~8.3% | ~$415 |
| Total | $50,000 | ~3.8% blended | ~$1,880/yr (~$157/mo) |
Illustrative projections based on trailing yields as of June 2026. Income is variable and not guaranteed.
Who Should (and Shouldn’t) Own Covered Call ETFs
Covered call ETFs like JEPI and JEPQ are a strong fit for:
- Retirees and near-retirees seeking reliable monthly income without selling shares
- Income supplementers who want cash flow to cover living expenses or reinvest strategically
- Investors holding them in Roth IRAs or IRAs to maximize after-tax efficiency
- Conservative accumulators who prefer lower volatility (especially JEPI, with beta 0.55)
- Investors in sideways or range-bound markets, where option premiums outpace index gains
Covered call ETFs are a poor fit for:
- Long-term accumulators in their 20s–40s prioritizing maximum compound growth — the upside cap will significantly reduce wealth over 20–30 years
- Investors using them as their entire equity portfolio — the capped upside denies you the full compounding power of equities
- High-bracket investors in taxable accounts — the ordinary income tax treatment substantially erodes the net yield advantage
- Risk-averse investors expecting crash protection — JEPI and JEPQ both fell sharply during sudden, fast sell-offs
To understand how covered call ETFs compare to traditional dividend growth strategies, our article on dividend growth investing for beginners is the perfect companion read. And if you are just starting your ETF journey, our foundational guide to what ETF investing is and how it works provides the essential context.
Conclusion & Call to Action
Now you have a complete picture of the covered call ETF explained — from the mechanics of option premium collection, to the ELN structures behind JEPI and JEPQ, to the real performance data, tax implications, and portfolio placement strategies for 2026.
The core insight is simple: covered call ETFs are excellent income tools used correctly, and wealth-destroying traps used incorrectly. As a satellite holding within a VOO-anchored portfolio, JEPI and JEPQ can meaningfully enhance your cash flow without destroying your long-term compounding engine. As a replacement for broad-market index funds, they will cost you dearly in a sustained bull market.
Ready to build your income portfolio? Start investing with low commissions through Interactive Brokers — one of the most trusted platforms for U.S. and international investors alike. For further research, Investopedia’s comprehensive covered call guide and J.P. Morgan Asset Management’s official fund pages are authoritative starting points.
Are you holding JEPI, JEPQ, or both in your portfolio? Leave a comment below and share your strategy. And if you want to explore more monthly income options, our complete passive income ETF portfolio guide covers every strategy worth considering in 2026.
FAQs
Q1: What is the main difference between a covered call ETF and a regular dividend ETF?A1: A regular dividend ETF — like SCHD or VIG — generates income from the dividends paid by the companies it holds. Those dividends reflect actual business profits and tend to grow over time. A covered call ETF — like JEPI or JEPQ — generates income primarily by selling option contracts on its stock holdings and collecting the resulting premiums. This means covered call ETFs can generate much higher current income (8–10% vs. 1.5–3.5% for dividend ETFs), but that income is mechanically generated, not tied to business fundamentals — and it comes at the cost of capped capital appreciation. For long-term wealth building, dividend growth ETFs like SCHD often win on total return. For current income today, covered call ETFs like JEPI offer a compelling yield advantage.
Q2: Is it safe to rely on JEPI or JEPQ for monthly income in retirement?A2: JEPI and JEPQ have delivered unbroken monthly distributions since their respective inceptions (2020 for JEPI, 2022 for JEPQ). However, the monthly distribution amounts fluctuate with market volatility — they rise when the VIX is high (more valuable option premiums) and shrink when markets are calm. Additionally, both ETFs experienced meaningful capital losses during sharp market sell-offs in April 2025 and March 2026. For retirees, this means JEPI and JEPQ are best used as one component of a diversified income portfolio — supplemented by more stable holdings like bond ETFs, SCHD, or dividend aristocrat stocks — rather than the sole source of retirement income. Holding them inside a Roth IRA or Traditional IRA also maximizes their after-tax value.
Q3: What is an Equity-Linked Note (ELN), and why do JEPI and JEPQ use them?A3: An Equity-Linked Note (ELN) is a structured debt instrument issued by a bank — such as Goldman Sachs, Citigroup, or JPMorgan — that delivers the economic return of simultaneously holding a stock and writing a call option against it. JEPI and JEPQ allocate roughly 15–20% of their assets to these ELNs rather than writing exchange-traded options directly. The advantage is operational efficiency — the bank handles the hedging mechanics, and the ETF receives the net premium income. The subtle risk is that ELN holders become senior unsecured creditors of the issuing bank — meaning if an issuing bank faced severe financial distress, the ELN value could decline even if the underlying stocks performed well. In practice, this is a low-probability scenario given the banks involved, but it is an important structural nuance every JEPI and JEPQ investor should understand before investing.
Financial Disclaimer: This article is intended for educational and informational purposes only. It does not constitute financial, investment, tax, or legal advice. All performance data, yield figures, distribution history, ETF characteristics, and projections referenced herein are based on publicly available information as of June 2026. Past performance does not guarantee future results. Investing in ETFs — including covered call ETFs such as JEPI and JEPQ — involves risk, including the potential loss of principal. Monthly distributions are variable and not guaranteed. Tax treatment varies by jurisdiction and individual circumstance. Always conduct thorough due diligence and consult a licensed financial advisor and qualified tax professional before making any investment decisions.