Every growth investor eventually faces the same pivotal choice: QQQ or SCHG? Both ETFs hold the world’s most dominant technology companies. Moreover, both have made long-term investors extraordinarily wealthy. However, they are not the same fund — and choosing the wrong one could quietly cost you thousands of dollars. Most comparisons treat these two ETFs as nearly identical. In reality, they differ significantly in cost, diversification, and index methodology. In 2026, with AI-driven tech stocks surging to record highs, the QQQ vs SCHG 2026 debate has never been more important. This complete breakdown uses fresh June 2026 data to show you exactly where each fund wins.
Key Takeaways:
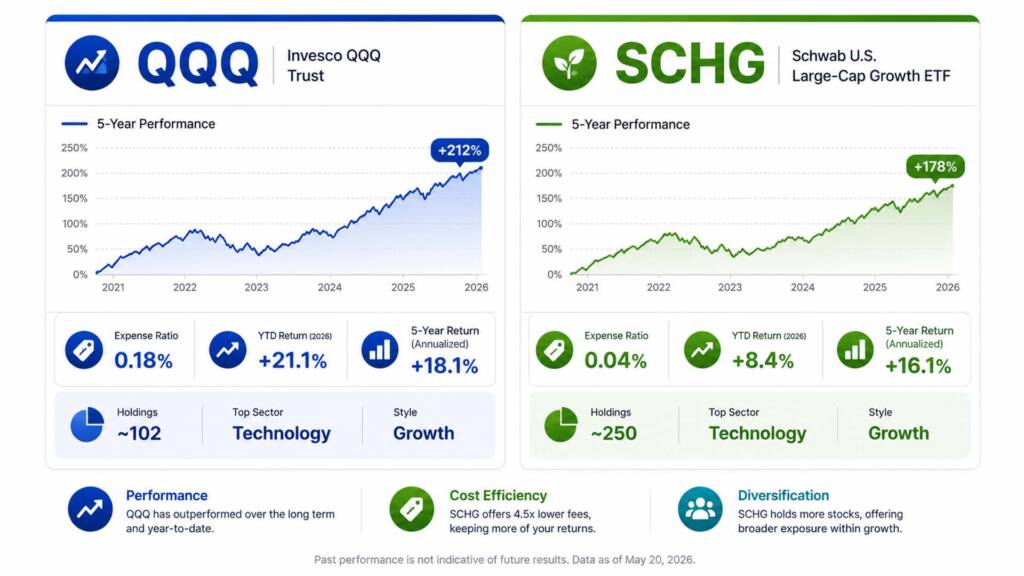
- QQQ delivered +21.1% YTD in 2026 versus SCHG’s +8.4% — driven by heavier Nasdaq-100 concentration in AI and semiconductor stocks.
- SCHG charges just 0.04% in annual fees versus QQQ’s 0.18% — making SCHG more than 4× cheaper and saving tens of thousands over a 20–30 year horizon.
- Both funds share ~62% overlap in top holdings — meaning the real decision comes down to cost, concentration, and your time horizon.
What Is QQQ? Fund Overview
QQQ is the Invesco QQQ Trust. Invesco launched this fund on March 10, 1999 — making it one of the oldest ETFs in existence. It tracks the Nasdaq-100 Index, which holds the 100 largest non-financial companies on the Nasdaq Stock Exchange.
As of June 2026, QQQ manages approximately $492 billion in AUM. As a result, it ranks among the largest and most liquid ETFs on the planet. Its daily trading volume routinely exceeds 40 million shares. Furthermore, since its 1999 launch, QQQ has gained approximately 1,600% in total return — including through the dot-com crash, the 2008 financial crisis, and the COVID-19 pandemic.
Technology dominates QQQ’s portfolio. Specifically, the tech sector accounts for approximately 67% of the fund, with consumer discretionary at ~18% and telecom at ~4%. Consequently, QQQ’s performance is heavily influenced by just a handful of mega-cap technology companies.
QQQ Key Stats — June 2026
| Metric | QQQ |
|---|---|
| Full Name | Invesco QQQ Trust |
| Issuer | Invesco |
| Inception Date | March 10, 1999 |
| Index Tracked | Nasdaq-100 |
| AUM | ~$492 Billion |
| Expense Ratio | 0.18% |
| Trailing Yield | ~0.40% |
| Holdings Count | 102 |
| YTD Return (2026) | +21.1% |
| 5-Year Ann. Return | +18.1% |
| 10-Year Ann. Return | +21.9% |
| Top Sector | Tech ~67% |
| Top Holding | NVIDIA ~8.6% |
What Is SCHG? Fund Overview
SCHG is the Schwab U.S. Large-Cap Growth ETF. Charles Schwab launched it on December 11, 2009. It tracks the Dow Jones U.S. Large-Cap Growth Total Stock Market Index — a broader benchmark that screens the 750 largest U.S. stocks for growth characteristics.
Currently, SCHG manages approximately $61 billion in AUM. While this is significantly smaller than QQQ, it is still a major fund in its own right. Most importantly, SCHG charges just 0.04% per year — one of the lowest expense ratios of any growth ETF available today.
Unlike QQQ, SCHG draws stocks from any U.S. exchange — not just the Nasdaq. Therefore, it includes NYSE-listed growth leaders that QQQ cannot hold. Additionally, its broader methodology results in approximately 197 holdings versus QQQ’s 102.
SCHG Key Stats — June 2026
| Metric | SCHG |
|---|---|
| Full Name | Schwab U.S. Large-Cap Growth ETF |
| Issuer | Charles Schwab |
| Inception Date | December 11, 2009 |
| Index Tracked | DJ U.S. Large-Cap Growth TMI |
| AUM | ~$61 Billion |
| Expense Ratio | 0.04% |
| Trailing Yield | ~0.30% |
| Holdings Count | 197 |
| YTD Return (2026) | +8.4% |
| 5-Year Ann. Return | +16.1% |
| 10-Year Ann. Return | +19.0% |
| Top Sector | Tech ~45% |
| Top Holding | NVIDIA ~11.6% |
QQQ vs SCHG 2026: Full Head-to-Head Comparison
| Feature | QQQ | SCHG |
|---|---|---|
| Issuer | Invesco | Charles Schwab |
| Inception | Mar 1999 | Dec 2009 |
| AUM | ~$492B | ~$61B |
| Expense Ratio | 0.18% | 0.04% |
| Holdings Count | 102 | 197 |
| Index | Nasdaq-100 | DJ US Large-Cap Growth |
| YTD Return (2026) | +21.1% | +8.4% |
| 5-Year Ann. Return | +18.1% | +16.1% |
| 10-Year Ann. Return | +21.9% | +19.0% |
| Tech Sector Weight | ~67% | ~45% |
| Top 10 Weight | ~47% | ~56% |
| Dividend Yield | ~0.40% | ~0.30% |
| Liquidity | Extremely High | High |
| Healthcare Exposure | ❌ Minimal | ✅ Yes |
| Holdings Overlap | ~62% | ~62% |
Top Holdings: What Do You Actually Own?
QQQ Top Holdings — June 2026
QQQ concentrates heavily in Nasdaq-listed mega-caps:
| Rank | Company | Weight |
|---|---|---|
| 1 | NVIDIA (NVDA) | ~8.6% |
| 2 | Apple (AAPL) | ~7.1% |
| 3 | Alphabet (GOOGL + GOOG) | ~6.7% |
| 4 | Microsoft (MSFT) | ~5.5% |
| 5 | Amazon (AMZN) | ~5.0% |
| 6 | Meta Platforms (META) | ~4.8% |
| 7 | Broadcom (AVGO) | ~4.2% |
| 8 | Tesla (TSLA) | ~3.6% |
| 9 | Costco (COST) | ~2.8% |
| 10 | Netflix (NFLX) | ~2.5% |
SCHG Top Holdings — June 2026
SCHG’s top holdings look similar — but with key differences:
| Rank | Company | Weight |
|---|---|---|
| 1 | NVIDIA (NVDA) | ~11.6% |
| 2 | Apple (AAPL) | ~9.6% |
| 3 | Alphabet (GOOGL + GOOG) | ~8.4% |
| 4 | Microsoft (MSFT) | ~7.0% |
| 5 | Amazon (AMZN) | ~5.8% |
| 6 | Meta Platforms (META) | ~4.6% |
| 7 | Broadcom (AVGO) | ~4.4% |
| 8 | Tesla (TSLA) | ~4.0% |
| 9 | Eli Lilly (LLY) | ~3.0% |
| 10 | Visa (V) | ~1.8% |
The key difference here is important. Eli Lilly — the pharmaceutical giant behind GLP-1 weight-loss drugs — appears prominently in SCHG. However, it is absent from QQQ’s Nasdaq-only universe. Furthermore, SCHG’s top holdings carry larger individual weights. Consequently, SCHG is actually more top-heavy than QQQ despite holding nearly twice as many stocks.
Where QQQ Wins: The Performance Case
QQQ’s 2026 Rally Has Been Extraordinary
In 2026, QQQ delivered a stunning +21.1% YTD total return. By comparison, SCHG returned +8.4% over the same period. That gap of nearly 13 percentage points reflects QQQ’s much heavier technology weighting.
Specifically, QQQ’s heavy allocation to AI semiconductors and memory storage stocks fueled this outperformance. NVIDIA — QQQ’s largest holding at ~8.6% — surged significantly in 2026 as AI infrastructure demand accelerated. As a result, QQQ’s concentrated tech exposure acted as a massive tailwind.
Long-Term Total Return Leadership
Over every major time horizon, QQQ has historically outperformed SCHG on a gross return basis. Over 10 years, QQQ delivered +21.9% annualized versus SCHG’s +19.0%. Furthermore, over 5 years, QQQ returned +18.1% annualized versus SCHG’s +16.1%.
These return differences compound powerfully over time. For example, at 21.9% annualized, $10,000 grows to approximately $740,000 over 20 years. In contrast, at 19.0% annualized, it grows to approximately $524,000. That is a difference of over $216,000 from the same starting investment.
Unmatched Liquidity and Global Recognition
QQQ’s $492 billion AUM makes it one of the most liquid investment vehicles ever created. Moreover, its brand recognition is unmatched — it is the benchmark ETF that institutional investors, options traders, and media commentators reference globally. For investors building portfolios using dollar-cost averaging, this liquidity provides confidence and tight bid-ask spreads at any trade size.
Where SCHG Wins: The Cost and Diversification Case
The Expense Ratio Gap Is a 30-Year Wealth Decision
SCHG’s 0.04% expense ratio versus QQQ’s 0.18% looks small on paper. Over 20–30 years, however, this 0.14% annual difference creates an enormous compounding gap.
Here is the math on a $500/month investment over 30 years at 15% gross annual return:
| Fund | Monthly Investment | Fee | Projected 30-Year Value | Est. Total Fees |
|---|---|---|---|---|
| SCHG | $500/mo | 0.04% | ~$2,967,000 | ~$32,000 |
| QQQ | $500/mo | 0.18% | ~$2,847,000 | ~$143,000 |
| Difference | — | 0.14% | ~$120,000 | ~$111,000 |
Illustrative projection at identical 15% gross returns. Not a guarantee of future results.
Therefore, the SCHG investor retains approximately $120,000 more over 30 years. Furthermore, they pay $111,000 less in fees. This is purely the result of choosing the cheaper fund.
Broader Diversification Across ~197 Holdings
SCHG’s 197 holdings provide meaningfully more diversification than QQQ’s 102. Additionally, SCHG includes healthcare innovators like Eli Lilly and financial-sector growth leaders absent from QQQ’s Nasdaq-only universe. As a result, SCHG is less exposed to a Nasdaq-specific regulatory or structural shock.
In 2026, healthcare innovation — particularly GLP-1 drug development — has emerged as one of the fastest-growing investment themes. Consequently, SCHG’s healthcare exposure gives it a meaningful sector advantage that QQQ completely misses.
Motley Fool’s June 2026 Verdict: SCHG Wins
Notably, Motley Fool published a direct comparison in June 2026 titled “Better ETF Buy Right Now: QQQ vs. SCHG.” Despite acknowledging QQQ’s superior YTD performance, they concluded: “I’m choosing the Schwab U.S. Large-Cap Growth ETF as the winner.”
Their reasoning was straightforward. First, SCHG’s broader diversification provides a better risk-adjusted profile. Second, its 0.04% expense ratio delivers a clear long-term cost advantage.
The Cost Impact: A 20-Year Simulation
Let us now look at a $100,000 lump-sum investment comparison at 15% gross annual returns:
| Holding | Starting Value | Annual Fee | Value After 20 Years | Fees Paid |
|---|---|---|---|---|
| SCHG | $100,000 | 0.04% | ~$1,577,000 | ~$5,100 |
| QQQ | $100,000 | 0.18% | ~$1,533,000 | ~$22,900 |
| Difference | — | 0.14% | ~$44,000 | ~$17,800 |
Illustrative only. Assumes identical 15% gross annual returns before fees. Past performance does not guarantee future results.
Consequently, the SCHG investor walks away with $44,000 more after 20 years — simply by choosing the cheaper fund. Furthermore, this gap widens significantly over 30 years. Therefore, for long-term buy-and-hold investors, the fee question deserves serious consideration.
Who Should Own QQQ?
QQQ is the right choice for investors who:
- Want pure Nasdaq-100 index exposure for strategic or options-hedging purposes
- Use QQQ options chains for portfolio protection or income strategies
- Prioritize maximum tech concentration and are comfortable with higher volatility
- Invest for shorter time horizons where fee compounding matters less
- Value extreme liquidity for large position sizing
Additionally, QQQ suits investors who specifically want the benchmark used by institutional funds and financial media globally. For a broader look at how QQQ compares against a diversified S&P 500 fund, our QQQ vs VOO analysis explores that matchup in full detail.
Who Should Own SCHG?
SCHG is the better choice for investors who:
- Plan to buy and hold for 20–30+ years — the fee savings compound dramatically
- Prioritize cost efficiency above all — 0.04% is among the lowest of any growth ETF
- Want broader diversification across ~197 holdings including healthcare and non-Nasdaq leaders
- Invest primarily inside a Roth IRA or 401(k) where compounding fee savings are maximized
- Seek large-cap growth exposure without being restricted to the Nasdaq-100 universe
Furthermore, SCHG suits investors who prefer a slightly lower-volatility growth ETF profile. Because SCHG’s tech weighting (~45%) is meaningfully lower than QQQ’s (~67%), it offers a smoother ride during Nasdaq-specific sell-offs.
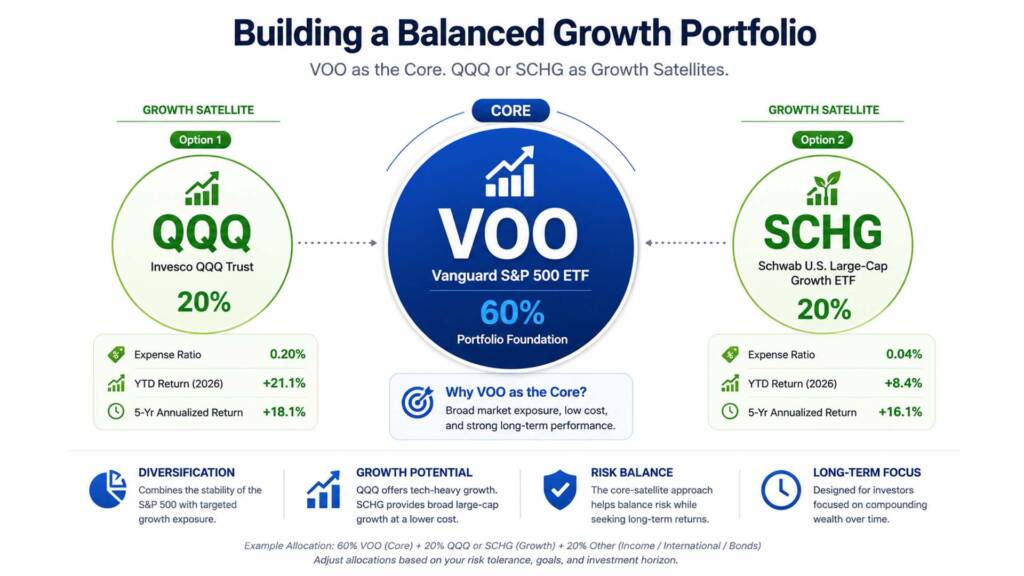
How to Use QQQ or SCHG in Your Portfolio
Neither QQQ nor SCHG should function as a complete portfolio. Instead, both work best as growth satellites alongside a stable core.
The recommended 2026 framework:
- Core (60–70%): VOO — Stable S&P 500 exposure; the essential foundation of every long-term portfolio. Our VOO ETF core portfolio guide shows exactly how to build around this anchor.
- Growth Satellite (20–30%): QQQ or SCHG — High-conviction tech and growth tilt for enhanced long-term return potential
- Income Layer (10%): SCHD — Dividend income and downside stability
Additionally, investors who want to understand the philosophical difference between prioritizing growth versus income should read our growth vs dividend investing guide. It directly addresses this core portfolio decision.
Finally, start building your position today through Interactive Brokers — one of the most cost-effective platforms for U.S. and international investors, with commission-free access to both QQQ and SCHG. For primary source data, Invesco’s official QQQ page and Schwab’s official SCHG page provide authoritative fund documentation.
Conclusion & Call to Action
After this full QQQ vs SCHG 2026 comparison, the verdict is clear. QQQ wins on raw performance — delivering +21.1% YTD versus SCHG’s +8.4%, with a superior 10-year annualized return of +21.9% vs +19.0%. However, SCHG wins on cost, diversification, and long-term compounding efficiency — making it the analytically superior choice for most buy-and-hold investors with a 20–30 year horizon.
Ultimately, the smartest approach is not choosing one or the other. Rather, it is anchoring your portfolio in VOO for full market participation, then adding either QQQ or SCHG as your growth satellite based on your priorities.
Which growth ETF are you holding in 2026 — QQQ, SCHG, or both? Drop your allocation in the comments below. Furthermore, if you want to explore a complete growth-focused ETF portfolio, our 3-ETF portfolio strategy guide gives you a ready-to-use framework for every investor profile.
FAQs
Q1: Is QQQ or SCHG better for long-term investors over 20+ years?
A1: For a long-term buy-and-hold horizon, most analysts favor SCHG. Specifically, its 0.04% expense ratio versus QQQ’s 0.18% saves significant capital over time. On a $100,000 investment at 15% annual returns, SCHG generates approximately $44,000 more wealth over 20 years. However, QQQ has historically delivered higher gross returns — +21.9% annualized over 10 years versus SCHG’s +19.0%. Therefore, the answer depends on whether future markets favor Nasdaq-concentrated tech or broader growth. For most passive investors using dollar-cost averaging over decades, SCHG’s fee advantage is a reliable, permanent edge.
Q2: What is the main difference between QQQ and SCHG?
A2: Three key differences separate these two funds.
First, index methodology: QQQ tracks the Nasdaq-100 (102 non-financial Nasdaq stocks by market cap). SCHG tracks the Dow Jones U.S. Large-Cap Growth Index (~197 large-cap growth stocks from any U.S. exchange).
Second, cost: QQQ charges 0.18% annually. SCHG charges 0.04% — making SCHG more than 4× cheaper. Over 30 years, this adds up to over $100,000 in additional compounded wealth on a $500/month investment.
Third, sector coverage: QQQ is ~67% technology and excludes financials entirely. SCHG is ~45% technology and includes healthcare leaders like Eli Lilly. Consequently, SCHG offers broader sector balance.
Q3: Can I hold both QQQ and SCHG in the same portfolio?
A3: You can — but it may not be efficient. Both funds share approximately 62% overlap in their top holdings. Consequently, holding equal positions in both primarily adds redundancy rather than diversification. Furthermore, you would pay a blended expense ratio between QQQ’s 0.18% and SCHG’s 0.04%.
Nevertheless, a small tactical split can make sense. For example, a 10% QQQ / 20% SCHG growth satellite alongside a 60% VOO core gives you Nasdaq-100 precision exposure through QQQ while keeping the majority of your growth allocation in the more cost-efficient SCHG. For practical allocation frameworks, our core-and-satellite portfolio guide provides detailed models for every investor profile.
Financial Disclaimer: This article is for educational and informational purposes only. It does not constitute financial, investment, tax, or legal advice. All performance data, expense ratios, AUM figures, and compounding simulations are based on publicly available information as of June 2026. Past performance does not guarantee future results. Both QQQ and SCHG carry equity market risk, including the potential loss of principal. Expense ratios and fund characteristics may change at the discretion of their respective issuers. Always consult a licensed financial advisor before making investment decisions.