What would your life look like if your bank account received a paycheck every single month — and you never had to work for it? No boss. No commute. No performance review. Just dividends, quietly funding your life while you sleep. The idea of living off dividends is one of the most searched topics in personal finance — and for good reason. But most people who dream about it never get a clear, honest answer to the most fundamental question: how much money do you actually need to live off dividends? Without a real number, the dream stays abstract and the plan never starts. This guide cuts through the noise and answers exactly that — using real 2026 data on U.S. living costs, current dividend yields, and the most effective ETFs available today to help you build a concrete, achievable plan.
Key Takeaways:
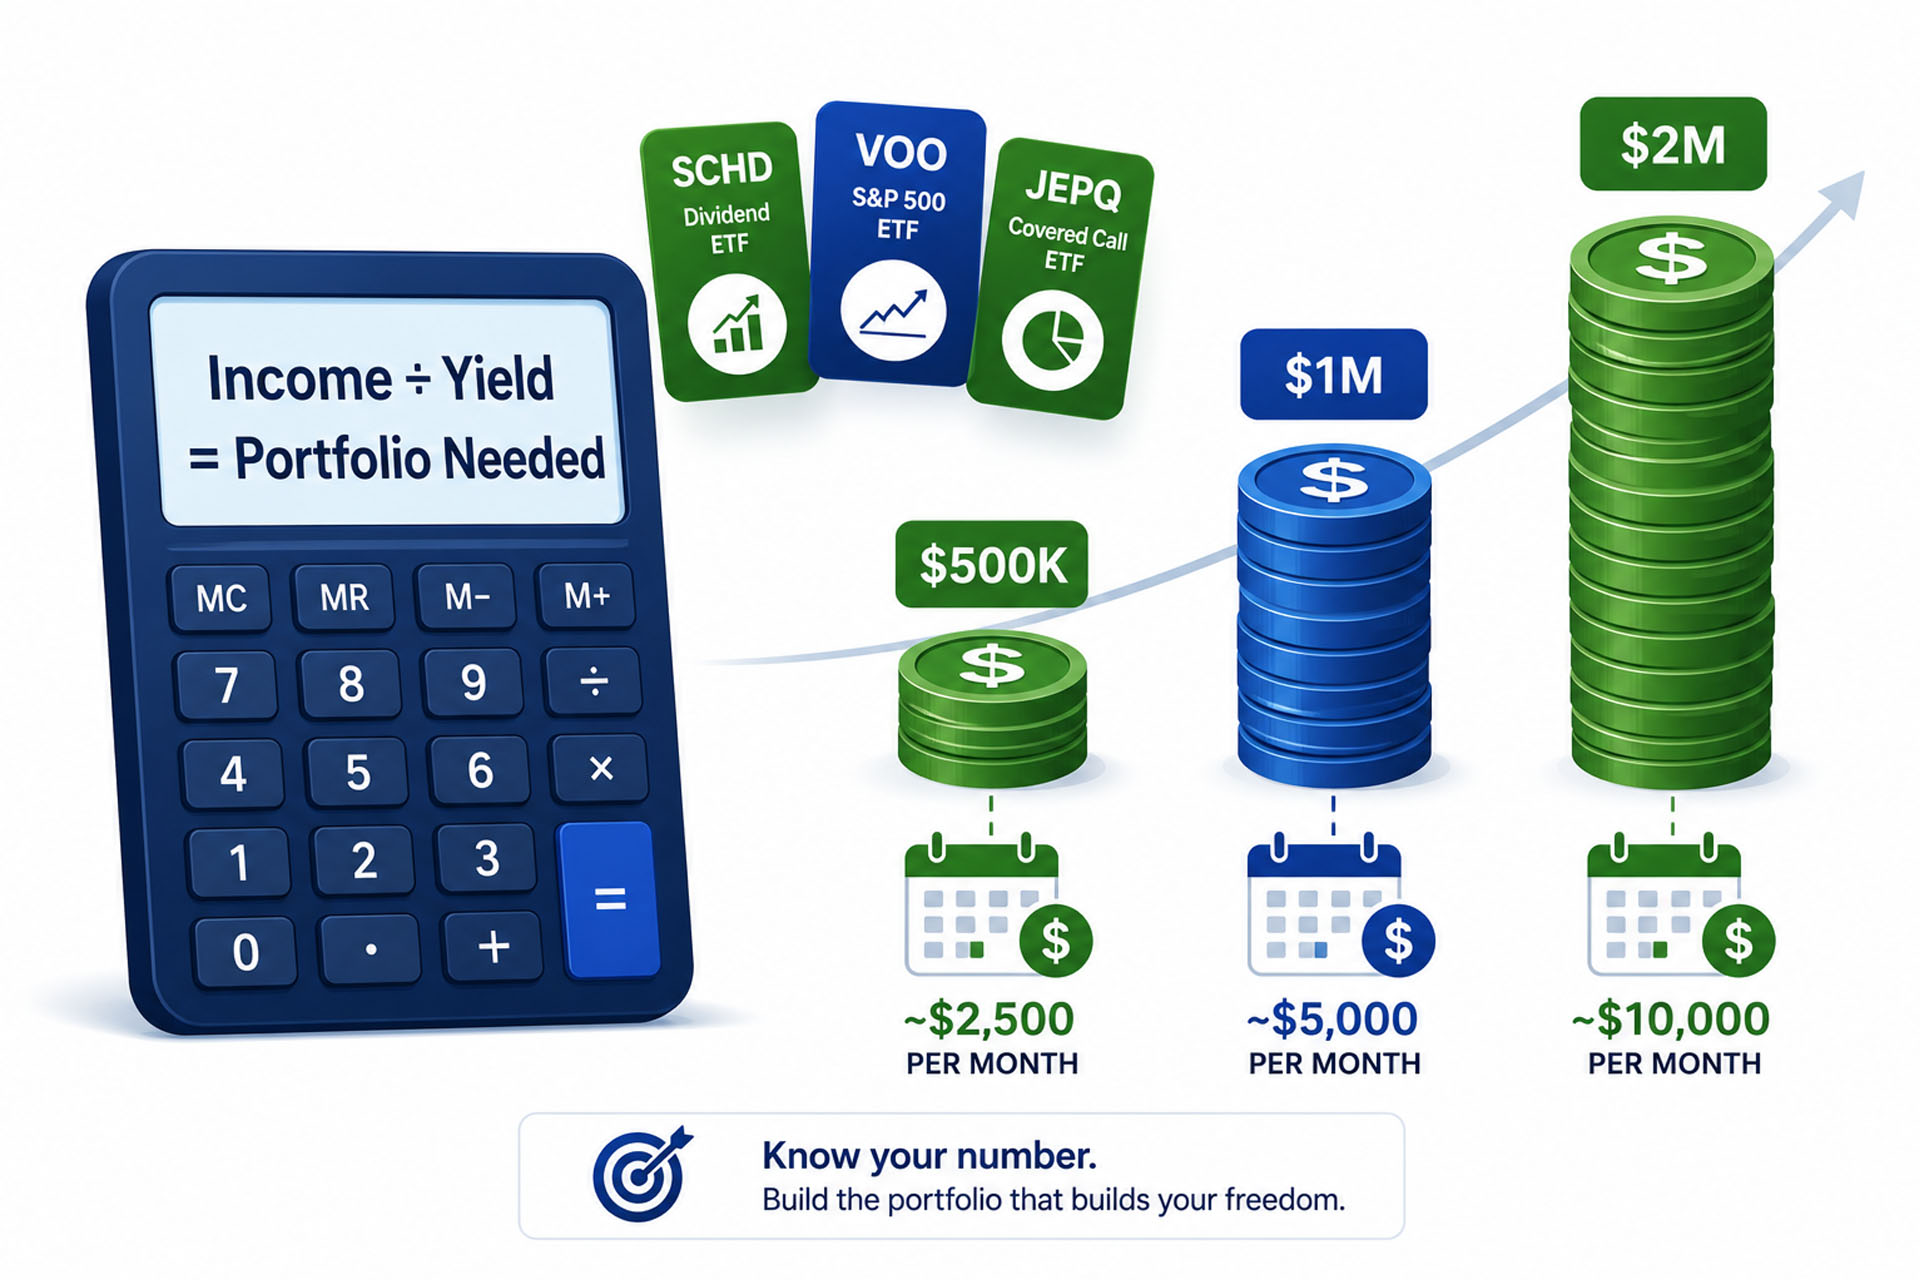
- The core formula is simple: Portfolio Needed = Annual Income ÷ Dividend Yield. A $50,000/year income target at a 4% portfolio yield requires approximately $1,250,000 in invested assets.
- The average U.S. household spends approximately $78,535 per year (~$6,545/month) in 2026 — meaning a typical American family needs a dividend portfolio of roughly $1.57–$2.36 million to fully cover living costs, depending on yield.
- Your yield choice is everything. A 3% yield portfolio requires 67% more capital than a 5% yield portfolio to generate the same income — making ETF selection the single most impactful dividend income decision.
The Core Formula: How Much Do You Need to Live Off Dividends?
The math behind living off dividends is elegantly simple. It requires only two inputs: your desired annual income and your portfolio’s dividend yield.
The Formula:
Portfolio Needed = Desired Annual Income ÷ Dividend Yield
For example, if you want $60,000/year in dividend income and your portfolio yields 4%, you need:
$60,000 ÷ 0.04 = $1,500,000
That is it. No guesswork. No complexity. The challenge is not the math — it is building the portfolio to get there.
The Complete Dividend Portfolio Size Table (2026)
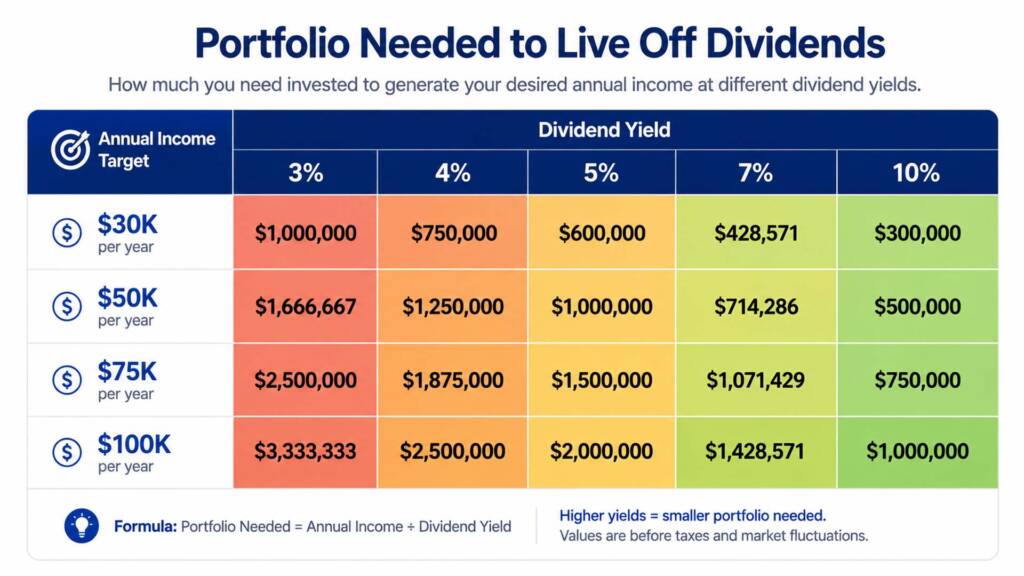
| Annual Income Target | At 3% Yield | At 4% Yield | At 5% Yield | At 7% Yield | At 10% Yield |
|---|---|---|---|---|---|
| $24,000/yr ($2K/mo) | $800,000 | $600,000 | $480,000 | $343,000 | $240,000 |
| $36,000/yr ($3K/mo) | $1,200,000 | $900,000 | $720,000 | $514,000 | $360,000 |
| $50,000/yr (~avg single) | $1,667,000 | $1,250,000 | $1,000,000 | $714,000 | $500,000 |
| $78,535/yr (avg U.S. HH) | $2,618,000 | $1,963,000 | $1,571,000 | $1,122,000 | $785,000 |
| $100,000/yr | $3,333,000 | $2,500,000 | $2,000,000 | $1,429,000 | $1,000,000 |
| $120,000/yr | $4,000,000 | $3,000,000 | $2,400,000 | $1,714,000 | $1,200,000 |
These are mathematical projections based on stated yields as of June 2026. Actual dividend income varies based on market conditions, ETF composition, and tax treatment.
The table immediately reveals the power of yield. Generating the average U.S. household income of $78,535/year requires $2.6 million at a 3% yield — but only $785,000 at a 10% yield. However, as we will explore shortly, yield is not the only factor that matters. Sustainability, growth, and total return are equally critical.
What Does It Cost to Live in America in 2026?
Before calculating how much you need, you need to know how much you spend. Here is what the data shows for 2026 U.S. living costs:
- Single person (with rent): ~$4,035/month ($48,420/year)
- Single person (without rent): ~$2,085/month ($25,020/year)
- Couple (2 adults, with rent): ~$5,465/month ($65,580/year)
- Family of four (with rent): ~$7,585/month ($91,020/year)
- Average U.S. household (all expenses): ~$6,545/month ($78,535/year)
According to the U.S. Bureau of Labor Statistics Consumer Expenditure Survey, the average American household now spends over $78,000 annually — with shelter costs surging and food prices up 3.1% year-over-year in 2026. These are not luxury figures. They represent the real cost of a standard American lifestyle.
The most important takeaway: your personal target is unique. A single person living modestly in Oklahoma (cost of living ~$67,147/year) has dramatically different needs than a family of four in Hawaii ($144,426/year). Define your personal lifestyle cost before you pick a portfolio target.
The Three Dividend Income Strategies: Choosing Your Yield
Not all dividend income is created equal. In 2026, investors have three primary yield strategies to choose from — each with different trade-offs between current income, growth, and risk.
Strategy 1: Conservative Dividend Growth (3–4% Yield)
This approach uses high-quality dividend growth ETFs — funds that prioritize companies with consistent, rising dividends over raw yield.
Best ETFs for this strategy:
- VOO (Vanguard S&P 500 ETF): ~1.3% yield, ~0.03% fee — best as a core growth anchor
- VIG (Vanguard Dividend Appreciation ETF): ~1.5% yield, 0.04% fee — 10+ years of consecutive dividend increases required
- SCHD (Schwab U.S. Dividend Equity ETF): ~3.2% yield, 0.06% fee — the most popular dividend growth ETF in 2026
The key advantage: These funds grow their dividends over time. SCHD’s 10-year dividend growth rate of ~10.6% means your income roughly doubles every 7 years — even without adding more capital. Over a 20-year horizon, this strategy frequently outperforms higher-yield alternatives on a total income basis. For a deep dive into this approach, read our complete guide on dividend growth investing for beginners.
Capital required (at blended 3.5% yield) for the average U.S. household ($78,535/year): ~$2,244,000
Strategy 2: Balanced Income (4–6% Yield)
This strategy blends dividend growth ETFs with moderately higher-yield funds.
Best ETFs for this strategy:
- SCHD + VOO (70/30 blend): Blended yield ~2.5–3.0%
- JEPI (JPMorgan Equity Premium Income ETF): ~8.2–8.5% yield, 0.35% fee
- A diversified 30-stock dividend portfolio: Targeting ~5% yield
According to Simply Safe Dividends, a well-constructed 30-stock equal-weight portfolio targeting 5% yield with only “Safe or Very Safe” dividend scores is entirely achievable in 2026 — combining dividend safety with meaningful income.
Capital required (at 5% blended yield) for the average U.S. household: ~$1,571,000
Strategy 3: High-Yield Income (8–12% Yield)
This strategy maximizes current income using covered call ETFs and higher-yield instruments.
Best ETFs for this strategy:
- JEPQ (JPMorgan Nasdaq Equity Premium Income ETF): ~10.1% yield, 0.35% fee
- JEPI (JPMorgan Equity Premium Income ETF): ~8.2% yield, 0.35% fee
The extraordinary yields of JEPQ (~10.1%) and JEPI (~8.2%) make this strategy appealing — but with important caveats. These ETFs use covered call strategies that cap upside in bull markets, their distributions are primarily taxed as ordinary income (not qualified dividends), and their monthly payments fluctuate with market volatility. To understand the mechanics in detail, our covered call ETF explained guide and full JEPQ ETF review 2026 cover every nuance.
Capital required (at 10% yield) for the average U.S. household: ~$785,000 — but with meaningful trade-offs in capital preservation and tax efficiency.
Real Income Scenarios: What Different Portfolios Pay in 2026
Let’s translate portfolio sizes into real monthly income across different ETF combinations:
Scenario A: The $500,000 Portfolio
| ETF Allocation | Amount | Yield | Annual Income |
|---|---|---|---|
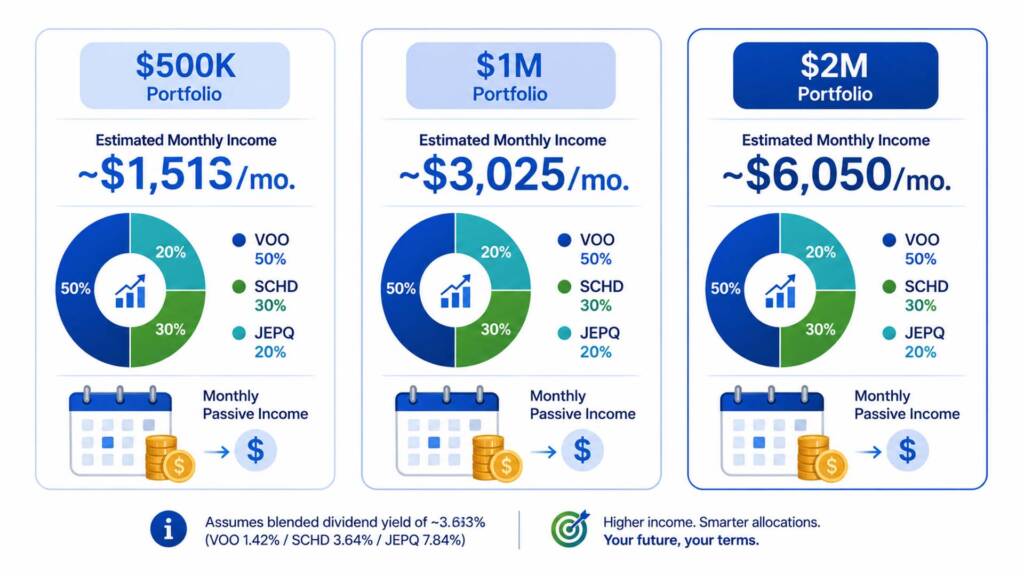
| VOO (50%) | $250,000 | 1.3% | $3,250 |
| SCHD (30%) | $150,000 | 3.2% | $4,800 |
| JEPQ (20%) | $100,000 | 10.1% | $10,100 |
| Total | $500,000 | ~3.6% blended | ~$18,150/yr (~$1,513/mo) |
A $500,000 portfolio generates roughly $1,513/month — a solid income supplement, but not enough to replace a full household income in most U.S. cities.
Scenario B: The $1,000,000 Portfolio
| ETF Allocation | Amount | Yield | Annual Income |
|---|---|---|---|
| VOO (50%) | $500,000 | 1.3% | $6,500 |
| SCHD (30%) | $300,000 | 3.2% | $9,600 |
| JEPQ (20%) | $200,000 | 10.1% | $20,200 |
| Total | $1,000,000 | ~3.6% blended | ~$36,300/yr (~$3,025/mo) |
At $1 million, this portfolio generates ~$3,025/month — enough to cover a single person’s living expenses in moderate-cost cities, especially if housing is paid off.
Scenario C: The $2,000,000 Portfolio (Full Household Replacement)
| ETF Allocation | Amount | Yield | Annual Income |
|---|---|---|---|
| VOO (50%) | $1,000,000 | 1.3% | $13,000 |
| SCHD (30%) | $600,000 | 3.2% | $19,200 |
| JEPQ (20%) | $400,000 | 10.1% | $40,400 |
| Total | $2,000,000 | ~3.6% blended | ~$72,600/yr (~$6,050/mo) |
A $2 million portfolio at this blended allocation generates approximately $6,050/month — closely matching the average U.S. household monthly expenditure of $6,545. Add Social Security or any part-time income and this fully covers a comfortable American lifestyle.
All scenarios are illustrative based on June 2026 trailing yields. Yields fluctuate. Past distributions do not guarantee future income.
The Tax Reality: What You Actually Take Home
One of the most overlooked factors in dividend income planning is taxes. Your gross dividend yield is not your net income.
In 2026, dividend income is taxed in two main ways:
Qualified Dividends (taxed at preferential rates):
- 0% if your taxable income is below ~$47,025 (single) or ~$94,050 (married)
- 15% for most middle-income earners
- 20% for high earners (above ~$518,900 single / ~$583,750 married)
Ordinary Income Dividends (taxed at your marginal rate):
- Applies to JEPQ, JEPI, and most covered call ETF distributions
- Can reach as high as 37% for top earners
Practical example: A $100,000 dividend income portfolio at 5% yield generating $5,000/year:
- If fully qualified dividends: tax ~$0–$750 (0–15%)
- If fully ordinary income (JEPQ-style): tax ~$1,100–$1,850 at a 22–37% bracket
The strategic solution: hold high-yield covered call ETFs (JEPQ, JEPI) inside Roth IRAs to completely eliminate this tax drag, and use qualified dividend ETFs (SCHD, VIG) in taxable accounts for preferential tax rates. This tax location strategy can meaningfully increase your effective net yield by 1–3 percentage points. Always consult a qualified tax professional for personalized advice.
The Inflation Risk: Why Your Portfolio Must Grow
A critical mistake many dividend investors make is focusing solely on current income while ignoring inflation.
In 2026, with food prices up 3.1% year-over-year and shelter costs continuing to surge, a dividend income that covers your expenses today will fall short in 10 years if it doesn’t grow. A $60,000/year income today buys only approximately $45,600 in today’s dollars after 10 years at 3% inflation.
This is precisely why dividend growth matters as much as current yield. SCHD’s 10-year dividend growth rate of ~10.6% dramatically outpaces inflation — meaning your income from SCHD more than doubles every 7 years, maintaining and even growing your purchasing power.
The dividend snowball effect is the mechanism behind this: as dividends grow and compound, your income accelerates exponentially over time without requiring additional capital contributions. Pairing a low-yield, high-growth ETF like VOO with income ETFs like SCHD in your core creates a portfolio that simultaneously preserves long-term capital appreciation and generates growing cash flow.
Our core-and-satellite portfolio guide shows you exactly how to structure this combination for both income today and growth tomorrow.
How to Build a Dividend Income Portfolio Step by Step
Ready to start building toward living off dividends? Here is a practical action plan:
Step 1: Define your income target.Calculate your actual monthly expenses. Use the 2026 U.S. cost of living benchmarks above as a reference. Be specific — $48,000/year is a far more useful goal than “I want passive income.”
Step 2: Choose your yield strategy.Decide between conservative growth (3–4%), balanced income (4–6%), or high-yield income (8–10%) based on your time horizon, tax situation, and risk tolerance.
Step 3: Calculate your exact portfolio target.Divide your annual income need by your target yield. If you want $60,000/year at 4%, you need $1,500,000. Use our FIRE Calculator to model your personalized timeline.
Step 4: Build your core ETF foundation.Start with VOO as your growth anchor (40–60% of the portfolio). Then layer in SCHD for dividend income and growth (20–30%), and optionally add JEPQ or JEPI for high-yield income in a Roth IRA (10–20%).
Step 5: Invest consistently with dollar-cost averaging.Contribute a fixed amount every month regardless of market conditions. Our guide to dollar-cost averaging explained shows why this approach outperforms timing the market over the long run.
Step 6: Reinvest all dividends during accumulation.Every dividend reinvested becomes new shares generating future dividends. At SCHD’s ~3.2% yield and ~10.6% growth rate, compounding reinvested dividends dramatically accelerates your timeline to living off dividends.
Step 7: Track your progress and rebalance annually.Review allocations once per year. For guidance on timing and methodology, our portfolio rebalancing guide is the definitive resource.
Start your dividend income portfolio today with low commissions at Interactive Brokers — one of the most cost-effective platforms for both U.S. and international investors, with full access to VOO, SCHD, JEPQ, and JEPI. For additional authoritative research, Investopedia’s dividend investing guide is an excellent free resource.
Conclusion & Call to Action
Now you have a complete, data-driven answer to the question of how to live off dividends and how much you need. The magic number depends entirely on three variables: your lifestyle expenses, your chosen dividend yield, and your tax situation.
For the average American household spending ~$78,535/year in 2026, a realistic pathway exists at every portfolio level — from a $785,000 high-yield portfolio to a $2.6 million conservative growth portfolio. The most powerful move you can make today is to start building your VOO-anchored core, layer in SCHD for growing income, and let the dividend snowball roll.
What is your dividend income target? Are you aiming for $1,000/month, $5,000/month, or full financial independence? Leave a comment below and share your plan. And if you are ready to map out your complete strategy, check out our passive income ETF portfolio guide and our step-by-step guide to building a dividend portfolio in 2026 for your complete blueprint.
FAQs
Q1: How much money do I need to live off dividends and never work again?A1: The answer depends on your personal annual expenses and your portfolio’s dividend yield. Using the core formula — Annual Expenses ÷ Dividend Yield = Portfolio Needed — the average U.S. household spending ~$78,535/year in 2026 would need approximately:
- $1,963,000 at a 4% blended yield (e.g., heavy SCHD/VOO mix)
- $1,571,000 at a 5% blended yield (diversified dividend stocks/ETFs)
- $785,000 at a 10% yield (JEPQ-heavy, in a Roth IRA for tax efficiency)
For a single person with lower expenses (~$48,000/year), the required portfolio drops significantly — to roughly $960,000 at 5% yield. The key is defining your actual personal expenses precisely, then selecting the yield strategy that matches your risk tolerance and time horizon. Try our FIRE Calculator for a personalized projection.
Q2: Is it better to use high-yield ETFs like JEPQ (10%) or dividend growth ETFs like SCHD (3.2%) to live off dividends?A2: The honest answer is: it depends on your stage and goals. JEPQ’s ~10.1% yield means you need far less capital to hit your income target — but its distributions are taxed as ordinary income, its upside is capped by the covered call structure, and monthly payments fluctuate with market volatility. SCHD’s ~3.2% yield requires more capital upfront, but its ~10.6% annual dividend growth rate means your income roughly doubles every 7 years — building an inflation-beating income stream that grows faster than your expenses. For most investors, the optimal approach is a hybrid portfolio: VOO and SCHD as the growing core (held in taxable accounts for qualified dividend treatment), and JEPQ inside a Roth IRA for tax-free high-yield income. Our SCHD vs DGRO 2026 comparison and JEPQ ETF review 2026 break down each option in full detail.
Q3: What is a realistic timeline to build a $1 million dividend portfolio from scratch?A3: The timeline depends primarily on how much you invest monthly and your portfolio’s average total return. Based on a VOO + SCHD blended portfolio with a historical average total return of approximately 10% per year:
- Investing $1,000/month: ~18.5 years to $1 million
- Investing $2,000/month: ~14.5 years to $1 million
- Investing $3,000/month: ~12 years to $1 million
- Investing $5,000/month: ~9 years to $1 million
The most powerful actions to compress this timeline: maximize your savings rate, reinvest every dividend during accumulation, use tax-advantaged accounts (401k, Roth IRA) to shelter compounding growth, and start as early as possible. Even at $500/month, you reach $1 million in approximately 22 years — entirely achievable for someone in their 30s targeting financial freedom in their 50s. Our guide to investing $50 a month in VOO shows that even the smallest starting amount makes a meaningful long-term difference.
Financial Disclaimer: This article is intended for educational and informational purposes only. It does not constitute financial, investment, tax, or legal advice. All data, income calculations, portfolio size projections, yield figures, and compounding simulations referenced herein are based on publicly available information and historical data as of June 2026. Dividend yields fluctuate with market conditions and are not guaranteed. Past performance does not guarantee future results. All investing involves risk, including the potential loss of principal. Tax treatment of dividends varies by jurisdiction, account type, and individual circumstances. The cost of living figures cited are national averages and may differ significantly based on your specific location and lifestyle. Always conduct thorough personal research and consult a licensed financial advisor and qualified tax professional before making any investment or retirement planning decisions.