Are you tired of watching your savings earn almost nothing in a bank account while inflation slowly erodes your purchasing power? That feeling is frustrating — and it’s exactly why millions of investors have turned to dividend ETFs. But with so many options available, picking the wrong one can cost you years of compounding returns. The solution? A fund with a proven track record, rock-bottom fees, and a growing income stream. In this SCHD ETF review 2026, we’ll break down everything you need to know about the Schwab US Dividend Equity ETF — so you can decide if it belongs in your portfolio today.
Key Takeaways:
- SCHD has delivered an impressive +19.48% year-to-date return as of mid-2026, outperforming its Morningstar Large Value category peers.
- The fund offers a 3.23%–3.26% dividend yield with a minimal 0.06% expense ratio and quarterly payouts.
- SCHD holds 103 fundamentally-screened US dividend stocks with over $94 billion in assets under management, making it one of the largest dividend ETFs in the world.
What Is the SCHD ETF?
The Schwab US Dividend Equity ETF (ticker: SCHD) is a passively managed exchange-traded fund issued by Charles Schwab. It was launched on October 20, 2011, and it tracks the Dow Jones U.S. Dividend 100 Index — a benchmark of 100 high-quality, dividend-paying U.S. equities selected for both yield and fundamental strength.
SCHD does not simply pick the highest-yielding stocks. Instead, it screens companies based on cash flow to total debt, return on equity, dividend yield, and five-year dividend growth rate. This process filters out dividend traps — companies with unsustainably high yields — and focuses on firms that can actually sustain and grow their payouts over time.
If you are brand new to the world of ETFs, check out our beginner’s guide to what is ETF investing before diving deeper into SCHD’s mechanics.
SCHD ETF Key Facts (June 2026)
Here is a quick snapshot of SCHD’s core statistics as of early June 2026:
| Metric | Data |
|---|---|
| Ticker | SCHD |
| Issuer | Charles Schwab |
| Exchange | NYSE Arca |
| Index Tracked | Dow Jones U.S. Dividend 100 |
| Inception Date | October 20, 2011 |
| Current Price | ~$32.59 |
| Total AUM | ~$94–$95 Billion |
| Expense Ratio | 0.06% |
| Number of Holdings | 103 |
| Dividend Yield (TTM) | ~3.23%–3.26% |
| Annual Dividend (TTM) | $1.06 per share |
| Payout Frequency | Quarterly |
| P/E Ratio | ~17.62–18.98 |
| 52-Week Range | $26.16 – $32.91 |
| Beta | 0.69 |
SCHD ETF Top Holdings and Sector Breakdown (2026)
As of June 2026, SCHD’s portfolio is heavily concentrated in defensive, high-quality blue-chip companies. The top 10 holdings account for roughly 42.98% of total assets.
Top 10 Holdings:
- QUALCOMM (QCOM) — 6.51%
- Texas Instruments (TXN) — 5.89%
- UnitedHealth Group (UNH) — 5.31%
- Chevron (CVX) — 3.96%
- Merck & Co. (MRK) — 3.91%
- Coca-Cola (KO) — 3.84%
- ConocoPhillips (COP) — 3.67%
- Amgen (AMGN) — 3.56%
- Procter & Gamble (PG) — 3.47%
- Verizon (VZ) — 3.42%
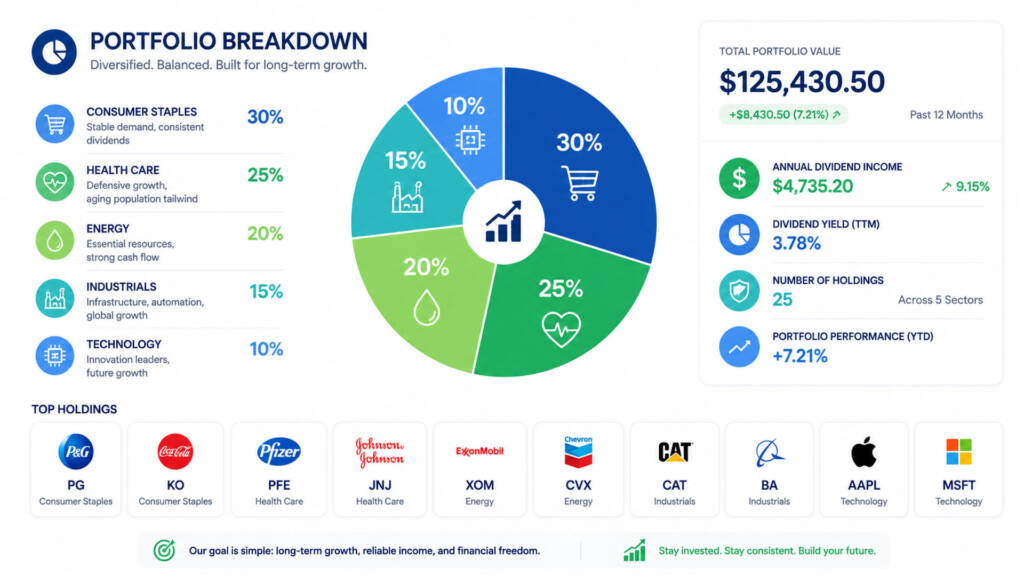
- Consumer Staples: 19.39%
- Health Care: 18.82%
- Energy: 16.87%
- Industrials: 11.46%
- Information Technology: 11.07%
- Financials: 9.01%
- Communication Services: 6.92%
- Consumer Discretionary: 6.42%
Notice that SCHD avoids the hyper-concentration in mega-cap technology stocks that you’d find in a fund like QQQ or VOO. This diversification across defensive sectors is a key reason why SCHD tends to hold up well during market downturns. Furthermore, SCHD’s portfolio trades at a P/E ratio of approximately 17–19x earnings — significantly cheaper than the broader S&P 500, which trades north of 25x.
SCHD ETF Performance in 2026
2026 has been an outstanding year for SCHD shareholders. The fund has delivered a remarkable +19.48% year-to-date return as of June 2026 (based on market price), well ahead of its Morningstar Large Value category peers which returned just +9.92% YTD.
Here is how SCHD’s annualized historical returns stack up:
| Period | SCHD Annualized Return |
|---|---|
| YTD 2026 | +19.48% |
| 1 Year | +28.98% |
| 3 Year | +16.15% |
| 5 Year | +8.66% |
| 10 Year | +12.88% |
| Since Inception (2011) | +13.30% |
Moreover, a $10,000 investment at SCHD’s inception has grown to approximately $32,621 today (with dividends reinvested), versus $28,680 for the Morningstar Large Value category average. That is a compelling case for long-term buy-and-hold investors.
It is also worth noting that SCHD’s beta is just 0.69 relative to the market. This means SCHD is approximately 31% less volatile than the overall stock market — a significant cushion during turbulent periods.
Quick Comparison: Curious how SCHD stacks up against another popular dividend ETF? Read our detailed SCHD vs VYM comparison and SCHD vs DGRO 2026 breakdown.
SCHD Dividend History and Yield
Dividend income is SCHD’s headline feature, and the 2026 data continues to impress. The fund pays quarterly dividends and has raised its payout for 13 consecutive years — a track record of consistency that few funds can match.
Recent Dividend Payment History:
| Ex-Dividend Date | Amount Per Share | Pay Date |
|---|---|---|
| March 25, 2026 | $0.2569 | March 30, 2026 |
| December 10, 2025 | $0.2782 | December 15, 2025 |
| September 24, 2025 | $0.2604 | September 29, 2025 |
| June 25, 2025 | $0.2602 | June 30, 2025 |
| March 26, 2025 | $0.2488 | March 31, 2025 |
The next ex-dividend date is expected around June 24, 2026. At the current price of ~$32.59, the trailing twelve-month dividend of $1.06 per share equates to a yield of approximately 3.23% — more than triple the S&P 500’s average yield of around 1.3%.
The Dividend Snowball in Action
Let’s look at a simple, realistic compounding simulation using current data.
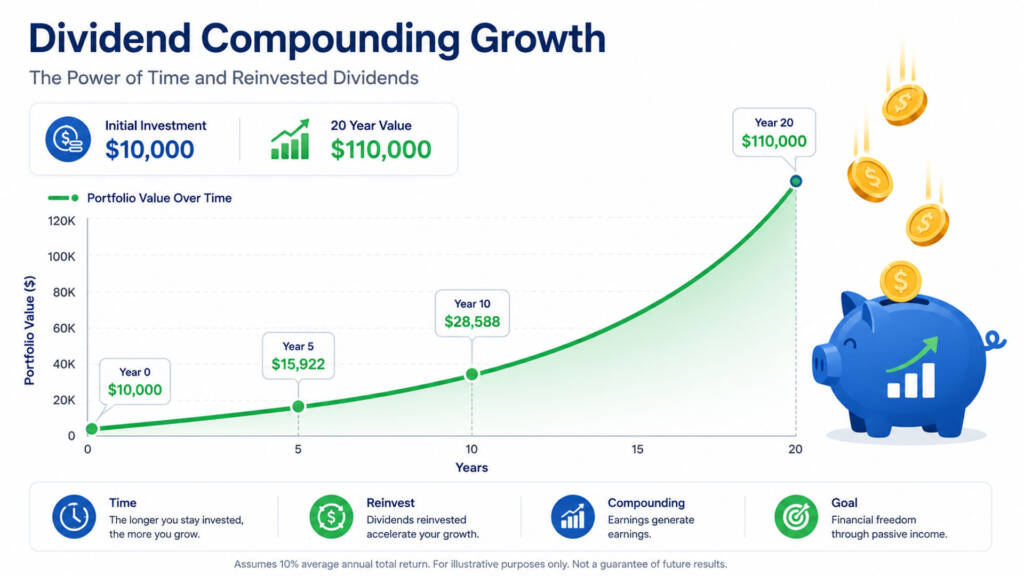
Assume you invest $10,000 in SCHD today at ~$32.59 per share (approximately 306 shares). You reinvest all dividends and SCHD grows at its historical 10-year annualized rate of 12.88% (including dividends):
| Year | Projected Portfolio Value |
|---|---|
| Year 1 | ~$11,288 |
| Year 5 | ~$18,234 |
| Year 10 | ~$33,246 |
| Year 20 | ~$110,618 |
⚠️ Important: These are projected outcomes based on historical returns. Past performance is not a guarantee of future results. Market conditions, interest rates, and economic cycles will affect actual returns.
This is the dividend snowball effect at work — your dividends buy more shares, which generate more dividends, creating a self-reinforcing cycle of growing passive income. Learn more about this powerful strategy in our article on the dividend snowball effect.
SCHD ETF Expense Ratio: Why 0.06% Is a Big Deal
One of SCHD’s most powerful features is its expense ratio of just 0.06% annually. In practical terms, that means you pay only $6 per year for every $10,000 invested.
Compare that to actively managed dividend funds that often charge 0.50% to 1.00% or more annually. Over a 20-year horizon, the fee savings from a low-cost fund like SCHD can compound into tens of thousands of dollars of additional wealth.
Wondering how SCHD’s costs compare to similar funds? Our SCHD vs VYM article breaks it down in detail.
Why SCHD Is Outperforming in 2026
Several key macro and structural factors are driving SCHD’s strong 2026 performance:
- Market rotation to value: Investors have been rotating away from high-multiple tech stocks toward value-oriented, cash-generating companies in SCHD’s portfolio.
- Rising interest rate sensitivity: SCHD’s defensive sectors (Consumer Staples, Health Care, Energy) have proven resilient in the current rate environment.
- Attractive valuation: SCHD’s portfolio P/E of ~17–19x is significantly cheaper than the S&P 500’s 25x+, making it appealing to value-conscious investors.
- Consistent dividend growth: SCHD’s 13-year streak of rising dividends attracts income-seeking institutional and retail investors alike.
As Barron’s noted earlier in 2026, SCHD is “trouncing the S&P 500 this year, reflecting investors’ renewed interest in ‘hard hat’ sectors after years of obsession with Silicon Valley.”
SCHD vs. VOO: Should You Hold Both?
A frequently asked question is: Do I choose SCHD or VOO? The answer, for many long-term investors, is both.
VOO (Vanguard S&P 500 ETF) is the bedrock of a diversified portfolio — it gives you broad exposure to the top 500 U.S. companies, including the dominant mega-cap tech growth engines. SCHD complements VOO by adding a dividend income layer and deeper exposure to value sectors, with only about 10% overlap between the two funds.
A balanced approach could be:
- Core (60–70%): VOO for broad market exposure and long-term growth
- Satellite (20–30%): SCHD for dividend income, lower volatility, and value diversification
Explore a full breakdown of how to build this type of strategy in our article on the core and satellite portfolio and our guide on building a dividend portfolio in 2026.
Who Should Buy SCHD ETF?
SCHD is an excellent fit for investors who match this profile:
- ✅ Income-focused investors who want growing quarterly dividend payments
- ✅ Risk-averse investors who prefer lower volatility (beta 0.69) over chasing high-growth stocks
- ✅ Long-term wealth builders using a dollar-cost averaging strategy
- ✅ Retirees or pre-retirees who need a reliable passive income stream
- ✅ Portfolio diversifiers who already hold VOO or QQQ and want to add a value/income layer
Who Might Want to Look Elsewhere?
SCHD may not be the best choice if:
- ❌ You are in your 20s and prioritize pure capital appreciation above income
- ❌ You want maximum tech exposure (SCHD significantly underweights mega-cap tech)
- ❌ You need a yield above 4% (some international dividend ETFs now outyield SCHD at ~4.4%)
Pros and Cons of SCHD ETF
Pros:
- Ultra-low 0.06% expense ratio — one of the cheapest dividend ETFs available
- 13+ consecutive years of dividend growth — a remarkable consistency record
- $94+ billion in AUM — extremely liquid and battle-tested
- Fundamental quality screening — removes dividend traps using cash flow and ROE metrics
- Low beta (0.69) — provides meaningful downside protection during market crashes
- Strong 2026 performance — +19.48% YTD, beating its category peers
Cons:
- Yield of ~3.2% may disappoint high-income seekers — alternatives like JEPI or international dividend ETFs yield 4–6%
- Underweights high-growth tech — investors who missed the AI rally felt this in prior years
- Annual reconstitution can cause turnover — holdings and sector weights shift each year
- Dividend subject to 30% withholding tax for non-US investors — international investors should factor this in
How to Start Investing in SCHD
Getting started with SCHD is straightforward:
- Open a brokerage account that provides access to U.S. markets. For international investors (including those in Singapore), Interactive Brokers is an excellent low-cost option. You can open an account using this referral link: IBKR Referral — Start Investing in SCHD.
- Search for the ticker “SCHD” on NYSE Arca.
- Decide your investment strategy — lump sum or dollar-cost averaging (DCA). For beginners, DCA reduces timing risk significantly.
- Set up DRIP (Dividend Reinvestment Plan) if your broker supports it. This automatically reinvests your quarterly dividends back into more SCHD shares.
- Rebalance annually to ensure SCHD fits your overall portfolio targets. Check out our guide on how often to rebalance your portfolio.
Also read: Beginner Investor Mistakes to Avoid before making your first purchase.
For a broader context on how SCHD fits alongside other ETFs, explore our 3-ETF portfolio strategy and passive income ETF portfolio articles.
Is SCHD Still Worth Buying in 2026?
Based on the current data, the answer is a confident yes — for the right investor. SCHD has proven itself as a resilient, income-generating, fundamentally strong ETF over more than a decade. Its 2026 performance has validated the case for dividend investing in a year when value stocks reasserted themselves against growth-heavy indices.
The fund’s $94+ billion in AUM, 0.06% expense ratio, 13+ years of dividend growth, and a +19.48% YTD return make it one of the strongest dividend ETFs available today. As part of a diversified portfolio — ideally alongside a broad-market core like VOO — SCHD can significantly enhance your income generation and reduce your overall portfolio volatility.
For more insights on growth vs. income investing philosophy, read our article: Growth vs. Dividend Investing — Which Strategy Is Right for You?
Conclusion & Call to Action
SCHD remains one of the most compelling dividend ETFs on the market in 2026. It combines quality stock selection, low costs, reliable income growth, and strong historical performance into a single, easy-to-own fund. Whether you are building your first income portfolio or diversifying a growth-heavy portfolio, SCHD deserves serious consideration.
What do you think — are you already holding SCHD, or are you considering adding it to your portfolio? Drop a comment below and let us know your strategy! And if you found this article helpful, check out our related guide: How to Build a Dividend Portfolio in 2026.
FAQs
Q1: Is SCHD a good ETF to buy for long-term passive income in 2026?
A1: Yes, SCHD is widely considered one of the best dividend ETFs for long-term passive income. It offers a ~3.23% dividend yield, 13+ years of consecutive dividend growth, a 0.06% expense ratio, and over $94 billion in assets under management. Its rigorous quality screening through the Dow Jones U.S. Dividend 100 Index ensures holdings are fundamentally sound.
Q2: What are the top holdings in SCHD ETF in 2026?
A2: As of June 2026, SCHD’s top holdings include Qualcomm (6.51%), Texas Instruments (5.89%), UnitedHealth Group (5.31%), Chevron (3.96%), Merck (3.91%), and Coca-Cola (3.84%). The fund is most heavily weighted toward Consumer Staples (19.39%), Health Care (18.82%), and Energy (16.87%).
Q3: How does SCHD ETF pay dividends and how often?
A3: SCHD pays dividends quarterly — typically in March, June, September, and December. The most recent dividend was $0.2569 per share paid on March 30, 2026 (ex-date: March 25, 2026). The next ex-dividend date is expected around June 24, 2026. The trailing twelve-month dividend totals approximately $1.06 per share, yielding around 3.23% at current prices.
Financial Disclaimer: This article is for educational and informational purposes only and does not constitute financial, investment, or tax advice. All performance data referenced reflects historical results, which are not a guarantee of future performance. Investment values can go up as well as down, and you may receive back less than you invest. Always conduct your own due diligence and consult a licensed financial advisor before making any investment decisions. SCHD ETF, like all investments, carries risk including potential loss of principal.