You have built your savings. You are ready to invest for passive income. And then you hit the wall that stops almost every dividend investor cold: SCHD or JEPI? Both are wildly popular. Both pay income. But they work in fundamentally different ways — and choosing the wrong one for your stage of life can cost you tens of thousands of dollars in either lost growth or missed income. The problem is that most comparisons present these two ETFs as rivals, when the real question is far more nuanced: are you investing to build income over time, or do you need income right now? This complete SCHD vs JEPI breakdown uses the freshest June 2026 data to show you exactly how each fund works, where each one wins decisively, and — spoiler alert — why the smartest investors often choose to own both.
Key Takeaways:
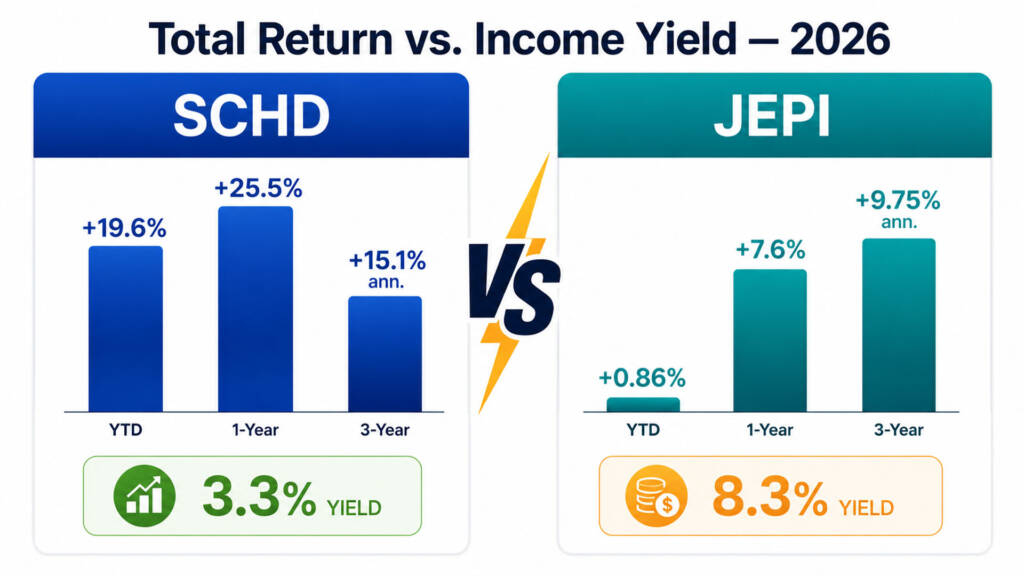
- SCHD is the long-term income compounder. In 2026, it has delivered a stunning ~19–25% YTD total return plus a ~3.3–4% growing dividend yield — dramatically outperforming JEPI’s ~0.4–0.86% YTD total return over the same period.
- JEPI is the monthly income maximizer. Its 8.26–8.45% trailing yield generates roughly 2.5× more monthly income per dollar invested than SCHD — making it ideal for investors who need cash flow today, particularly inside tax-sheltered accounts.
- The core trade-off is structural: SCHD captures full upside in bull markets; JEPI’s covered call strategy caps that upside in exchange for higher current income — making market conditions and your personal timeline the deciding factors.
SCHD vs JEPI: Fund Profiles at a Glance
Before diving into the data, it helps to understand that SCHD and JEPI are built on completely different income philosophies. One grows income over time through business fundamentals; the other engineers income from options mechanics. Understanding this distinction is everything.
SCHD — Schwab U.S. Dividend Equity ETF
SCHD (Schwab U.S. Dividend Equity ETF) launched on October 20, 2011, and has grown into one of the most beloved dividend ETFs ever created, now managing approximately $71.6 billion in AUM. It tracks the Dow Jones U.S. Dividend 100 Index — a rules-based benchmark requiring 10+ consecutive years of dividend payments, strong cash flow to debt ratios, high return on equity, and dividend growth history.
SCHD holds approximately 100–104 high-quality dividend-paying U.S. stocks that pass this rigorous multi-factor screen. In 2026, SCHD underwent its annual reconstitution in March, adding new holdings with stronger dividend profiles and some limited technology exposure to modernize the portfolio. Notably, since inception in 2011, SCHD has delivered a cumulative total return of ~478% — equivalent to approximately 13.3% annualized — turning a hypothetical $10,000 investment into nearly $58,000.
Key SCHD Stats — June 2026:
| Metric | SCHD |
|---|---|
| Issuer | Charles Schwab |
| Inception | October 20, 2011 |
| AUM | ~$71.6 Billion |
| Expense Ratio | 0.06% |
| Trailing Yield | ~3.23–3.97% |
| Forward Dividend Yield | ~3.81% |
| Dividend Payment | Quarterly |
| YTD Total Return (2026) | ~+19.6% |
| 1-Year Total Return | ~+25.49% |
| 3-Year Annualized Return | ~+15.09% |
| 5-Year Annualized Return | ~+8.05% |
| 10-Year Annualized Return | ~+12.56% |
| Beta (5-Year) | ~0.75 |
| Holdings Count | ~100–104 |
| Dividend Growth (1-Year) | ~1.56% |
JEPI — JPMorgan Equity Premium Income ETF
JEPI (JPMorgan Equity Premium Income ETF) launched on May 20, 2020, and rapidly became the largest actively managed ETF in the United States, currently managing approximately $44–$44.5 billion in AUM. It is an actively managed fund that generates income through two parallel mechanisms: holding a portfolio of defensive S&P 500 stocks AND selling call options via Equity-Linked Notes (ELNs) — collecting option premiums that become monthly distributions.
JEPI makes 12 payments per year — every single month — making it uniquely attractive to investors who need regular cash flow. However, its income is not from business dividends. It is engineered from option premiums, which means the monthly payment size fluctuates with market volatility and is primarily taxed as ordinary income rather than qualified dividends.
Key JEPI Stats — June 2026:
| Metric | JEPI |
|---|---|
| Issuer | J.P. Morgan Asset Management |
| Inception | May 20, 2020 |
| AUM | ~$44–$44.5 Billion |
| Expense Ratio | 0.35% |
| Trailing 12-Month Yield | ~8.26–8.45% |
| 30-Day SEC Yield | ~9.78% |
| Dividend Payment | Monthly |
| YTD Total Return (2026) | ~+0.41–0.86% |
| 1-Year Total Return | ~+7.62–9.35% |
| 3-Year Annualized Return | ~+9.75% |
| 5-Year Annualized Return | ~+7.57% |
| Beta (5-Year) | ~0.55 |
| Holdings Count | ~100–106 |
| Distribution Type | Primarily ordinary income |
SCHD vs JEPI: The Full Head-to-Head Comparison
| Feature | SCHD | JEPI |
|---|---|---|
| Issuer | Schwab | J.P. Morgan |
| Inception | Oct 2011 | May 2020 |
| AUM | ~$71.6B | ~$44.5B |
| Expense Ratio | 0.06% | 0.35% |
| Trailing Yield | ~3.3–4.0% | ~8.3–8.5% |
| Payment Frequency | Quarterly | Monthly |
| YTD Return (2026) | ~+19.6% | ~+0.4–0.9% |
| 1-Year Total Return | ~+25.5% | ~+7.6–9.4% |
| 3-Year Ann. Return | ~+15.1% | ~+9.75% |
| 5-Year Ann. Return | ~+8.1% | ~+7.6% |
| 10-Year Ann. Return | ~+12.6% | N/A |
| Dividend Tax Treatment | Qualified (0–20%) | Ordinary (up to 37%) |
| Upside Capture | Full | Capped (covered calls) |
| Downside Protection | Moderate | Better (lower beta 0.55) |
| Dividend Growth | ~10–11% historical | Fluctuating / declining |
| Income Source | Business dividends | Option premiums + dividends |
| Best Environment | Bull markets | Flat or sideways markets |
| Beta | ~0.75 | ~0.55 |
Where SCHD Wins Decisively
Total Return in 2026 Is Not Even Close
In 2026, the SCHD vs JEPI performance gap has been dramatic. SCHD has delivered approximately +19.6% YTD total return as of June 2026, while JEPI has returned approximately +0.4–0.9% YTD. That is a gap of nearly 19 percentage points in just six months. Over one full year, SCHD’s ~25.5% total return dwarfs JEPI’s ~7.6–9.4%.
This gap is not a one-off anomaly. Over every measurable time horizon where both funds overlap, SCHD’s total return leads. A $100,000 investment over the past 5.5 years grew to approximately $192,400 in SCHD versus $181,000 in JEPI — a ~6% gap in SCHD’s favor, even after accounting for JEPI’s much higher income distributions.
Dividend Growth Creates Compounding Income
SCHD’s dividend growth story is one of the most compelling in the ETF universe. Since inception, SCHD has grown its dividend at approximately 10–11% per year, with a historical track record of 12+ consecutive years of dividend increases. By contrast, JEPI’s monthly distributions have been declining slightly — down approximately 1.90% year-over-year — because option premium income shrinks in low-volatility bull markets.
This dynamic reveals a fundamental truth: SCHD’s income grows over time, while JEPI’s income shrinks in favorable markets. For investors who plan to hold for 15–25 years, SCHD’s compounding dividend growth will eventually generate a higher annual income than JEPI on a yield-on-cost basis — without the tax drag. For a deeper look at this compounding mechanism, our guide on the dividend snowball effect explains exactly how dividend growth accelerates income over time.
Tax Efficiency Is a Major Advantage
SCHD’s distributions are primarily qualified dividends — taxed at preferential rates of 0%, 15%, or 20% depending on your income. At a 15% qualified dividend rate, a 3.5% SCHD yield nets approximately 2.98% after-tax. Meanwhile, JEPI’s distributions are primarily ordinary income — taxed at your full marginal rate of up to 37%. At a 24% ordinary income rate, an 8.3% JEPI yield nets approximately 6.3% after-tax in a taxable account. The gap narrows significantly when taxes are factored in — making SCHD’s tax efficiency particularly valuable for investors in higher brackets holding in taxable brokerage accounts.
Where JEPI Wins Decisively
Current Income Per Dollar Invested
If you need more dollars of income today, JEPI wins clearly. At an 8.3% trailing yield versus SCHD’s 3.3%, JEPI generates approximately 2.5× more monthly cash flow per dollar invested. On a $500,000 portfolio, this difference is tangible:
| Fund | Portfolio | Yield | Monthly Income |
|---|---|---|---|
| SCHD | $500,000 | 3.3% | ~$1,375/mo |
| JEPI | $500,000 | 8.3% | ~$3,458/mo |
That additional ~$2,083/month from JEPI can cover real expenses — mortgage payments, living costs, travel — making it invaluable for retirees or near-retirees who need immediate cash flow without selling shares. Our guide on how much you need to live off dividends shows exactly how this income math plays out in a full retirement scenario.
Stability in Flat and Down Markets
JEPI’s beta of ~0.55 means it moves roughly 45% less than the broader market in both directions. During periods of sideways price action or moderate declines — where SCHD’s equity portfolio loses value — JEPI’s option premiums provide a meaningful income buffer that offsets price weakness.
In 2025, when SCHD returned just +4.34% total, JEPI delivered +8.10% — reversing the performance dynamic entirely. This pattern confirms that JEPI performs best in flat or declining markets where option premiums compensate for minimal price appreciation. For investors worried about near-term market volatility, JEPI’s lower beta provides a smoother ride than SCHD’s equity-only approach.
Monthly Payments for Cash Flow Planning
JEPI’s monthly distribution schedule provides a structural advantage for income budgeting. Knowing that a payment arrives on the first Friday of every month makes expense planning dramatically easier than SCHD’s quarterly distribution cadence. For retirees managing monthly bills — rent, utilities, healthcare — a predictable monthly paycheck from JEPI reduces the need to sell shares or maintain large cash reserves.
The 2026 Performance Context: Why SCHD Is Crushing JEPI Right Now
In 2026, U.S. equity markets have rallied broadly, with the S&P 500 posting positive YTD gains. This is exactly the environment where covered call strategies like JEPI underperform — their option overlays cap participation in rising markets, giving up the upside in exchange for premiums that are worth less during low-volatility rallies.
SCHD has simultaneously benefited from two powerful tailwinds: the S&P 500 rally has lifted its portfolio value, and its annual March 2026 reconstitution brought in several high-quality dividend payers with strong growth profiles. The result: SCHD has delivered full equity upside PLUS its dividend income — a dominant combination in 2026.
However, this performance gap will not persist forever. When markets turn volatile, flatten, or decline, JEPI’s income buffer becomes more valuable and SCHD’s equity exposure creates more risk. Smart investors recognize that both ETFs have their moment — and the cycle will rotate again.
Who Should Own SCHD?
SCHD is the right choice for:
- Long-term accumulators (20s–50s) building wealth over 15–30 years — dividend growth compounds aggressively
- Tax-conscious investors in taxable accounts — qualified dividends minimize the tax bill annually
- FIRE investors targeting yield-on-cost growth — SCHD’s 10–11% annual dividend growth builds extraordinary income over time
- Investors prioritizing total return — SCHD’s equity gains plus dividend income have historically outperformed over multi-year periods
- Bull market environments — SCHD captures full upside in rising markets
To understand SCHD’s full profile, our dedicated SCHD ETF review 2026 covers every metric, recent reconstitution changes, and long-term outlook in detail.
Who Should Own JEPI?
JEPI is the right choice for:
- Retirees and near-retirees who need maximum monthly cash flow immediately
- Investors in Roth IRAs or Traditional IRAs — tax-sheltered accounts eliminate JEPI’s ordinary income tax drag
- Conservative investors who want lower volatility (beta ~0.55) than a pure equity dividend fund
- Sideways or volatile market environments — JEPI’s premiums compensate when prices go nowhere
- Income supplements — investors adding JEPI as a satellite for cash flow alongside a VOO/SCHD growth core
For a full deep dive into JEPI’s mechanics — including its ELN structure, monthly distribution history, and the full JEPI vs JEPQ comparison — our covered call ETF explained guide is the essential starting resource.
The Best Strategy: Own Both (With VOO as the Core)
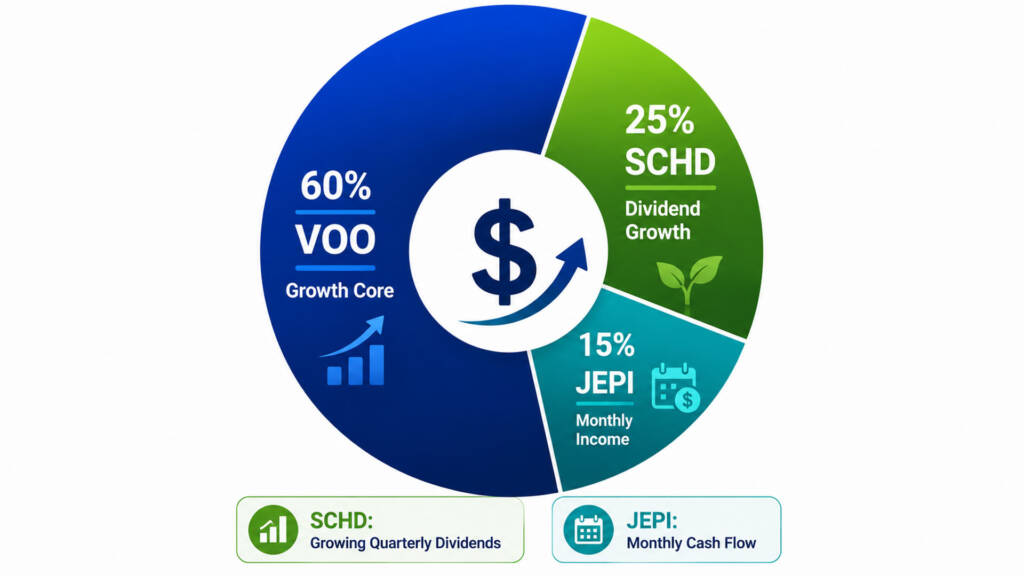
The most sophisticated answer to the SCHD vs JEPI question is not a binary choice. It is a structured, three-layer portfolio:
The Recommended Framework:
- 60% VOO — Primary growth engine; full S&P 500 upside and compounding; the non-negotiable core of every long-term portfolio
- 25% SCHD — Dividend growth layer; growing quarterly income; tax-efficient qualified dividends in taxable accounts
- 15% JEPI — Income satellite; monthly cash flow boost; ideally held in a Roth IRA to eliminate ordinary income tax
This structure gives you: full market participation through VOO, rising quarterly dividend income through SCHD, and a monthly income check through JEPI — all at a blended yield of approximately 3.2–3.8% with meaningful growth potential.
On a $300,000 portfolio at this allocation, here is the projected annual income:
| Holding | Amount | Yield | Annual Income |
|---|---|---|---|
| VOO (60%) | $180,000 | 1.3% | $2,340 |
| SCHD (25%) | $75,000 | 3.5% | $2,625 |
| JEPI (15%) | $45,000 | 8.3% | $3,735 |
| Total | $300,000 | ~2.9% blended | ~$8,700/yr (~$725/mo) |
Illustrative projection based on June 2026 trailing yields. Income is variable and not guaranteed.
For more portfolio blueprints combining these three funds, our VOO and JEPQ portfolio guide and 3-ETF portfolio strategy provide ready-to-use frameworks. Additionally, our broader passive income ETF portfolio guide maps out complete allocation strategies for every income goal.
Start building this combined portfolio today through Interactive Brokers — one of the most cost-effective platforms for U.S. and international investors alike, offering commission-free access to SCHD, JEPI, and VOO. For additional reading, Investopedia’s comprehensive SCHD vs JEPI analysis provides further authoritative context on both funds.
Conclusion & Call to Action
After this comprehensive SCHD vs JEPI breakdown, the picture is clear. SCHD wins on total return, dividend growth, tax efficiency, and long-term compounding power. JEPI wins on current income per dollar, monthly payments, and lower volatility in flat or down markets.
In 2026, SCHD’s ~19–25% YTD return has made the performance gap impossible to ignore. But in 2025 — when markets were flat — JEPI’s 8%+ income distribution made the stronger case. The smartest investors do not pick sides. They build portfolios where both ETFs play their specific role — while anchoring everything with VOO as the core.
Which camp are you in — Team SCHD, Team JEPI, or Team Both? Drop a comment below and share your current allocation. And if you want to compare SCHD against its closest dividend growth competitors, our SCHD vs DGRO 2026 comparison is your next essential read.
FAQs
Q1: Is SCHD or JEPI better for a dividend income portfolio in 2026?
A1: In 2026’s bull market environment, SCHD has been significantly better on a total return basis — delivering ~19–25% YTD total return versus JEPI’s ~0.4–0.9%. However, “better” depends entirely on your goal. If you need maximum current monthly income — especially inside a Roth IRA — JEPI’s 8.3% yield generates 2.5× more cash per dollar than SCHD’s ~3.3%. If you are building wealth over 15–30 years and value tax-efficient qualified dividends and compounding dividend growth, SCHD is clearly superior. For most investors, the optimal approach is holding both alongside VOO: SCHD in a taxable account for qualified dividend tax efficiency, and JEPI in a Roth IRA to shield its ordinary income distributions. Our guide to building a dividend portfolio in 2026 shows exactly how to structure this combination.
Q2: Does JEPI’s higher yield make it better than SCHD for retirement income?
A2: JEPI’s higher yield is real — but it comes with three critical trade-offs that every retiree must understand. First, JEPI’s distributions are primarily ordinary income (taxed at up to 37%), while SCHD’s are qualified dividends (taxed at 0–20%). Second, JEPI’s monthly payments fluctuate with market volatility — they are higher when volatility is elevated and lower in calm bull markets. JEPI’s distribution actually declined ~1.9% year-over-year in 2025–2026, while SCHD’s dividend grew. Third, JEPI’s covered call structure means it does not participate fully in bull markets, limiting total portfolio growth over a 10–20 year retirement. For retirees, the recommended approach is holding JEPI inside a Roth IRA to eliminate the tax drag, while maintaining SCHD and VOO in the taxable portion of the portfolio for tax-efficient income and full market participation.
Q3: Can I hold both SCHD and JEPI in the same portfolio?
A3: Absolutely — and many experienced income investors do exactly this. SCHD and JEPI are highly complementary because they perform well in opposite market environments. SCHD outperforms in bull markets (as demonstrated convincingly in 2026); JEPI outperforms in flat or volatile markets (as demonstrated in 2025). Together with VOO as the growth anchor, a combined SCHD + JEPI allocation creates a portfolio that generates income in all market conditions. The most tax-efficient structure is: VOO + SCHD in a taxable brokerage account (to benefit from qualified dividend tax rates), and JEPI in a Roth IRA (to shield its ordinary income from taxation). This allocation captures full market growth through VOO, growing dividend income through SCHD, and maximum monthly cash flow through JEPI — the three income dimensions every serious investor wants in their portfolio.
Financial Disclaimer: This article is intended for educational and informational purposes only. It does not constitute financial, investment, tax, or legal advice. All performance data, yield figures, total return statistics, dividend growth rates, AUM figures, and income simulations referenced herein are based on publicly available information as of June 2026. Past performance — including all historical returns for SCHD and JEPI — does not guarantee future results. Dividend and distribution amounts are variable and not guaranteed. Tax treatment of distributions varies by jurisdiction, account type, income level, and individual financial circumstances. SCHD and JEPI carry different risk profiles, and both involve the risk of loss of principal. Always conduct thorough personal research and consult a licensed financial advisor and qualified tax professional before making any investment or retirement planning decisions.