You’ve finally decided to start building long-term wealth. You open your brokerage account, ready to invest — and then you hit a wall. There are two near-identical Vanguard ETFs staring back at you: VTI and VOO. Both are from Vanguard. Both charge rock-bottom fees. Both track the U.S. stock market. But which one is actually better for a buy-and-hold strategy?
The confusion is real — and it costs investors time they could spend being in the market. Overthinking this choice is one of the most common beginner mistakes in index fund investing. Fortunately, the answer is clearer than you think. In this article, we break down the VTI vs VOO debate with real data, straightforward analysis, and a definitive recommendation for your long-term portfolio in 2026.
Key Takeaways:
- Both VTI and VOO share a 0.03% expense ratio and have a 99%+ correlation — meaning they move nearly in lockstep.
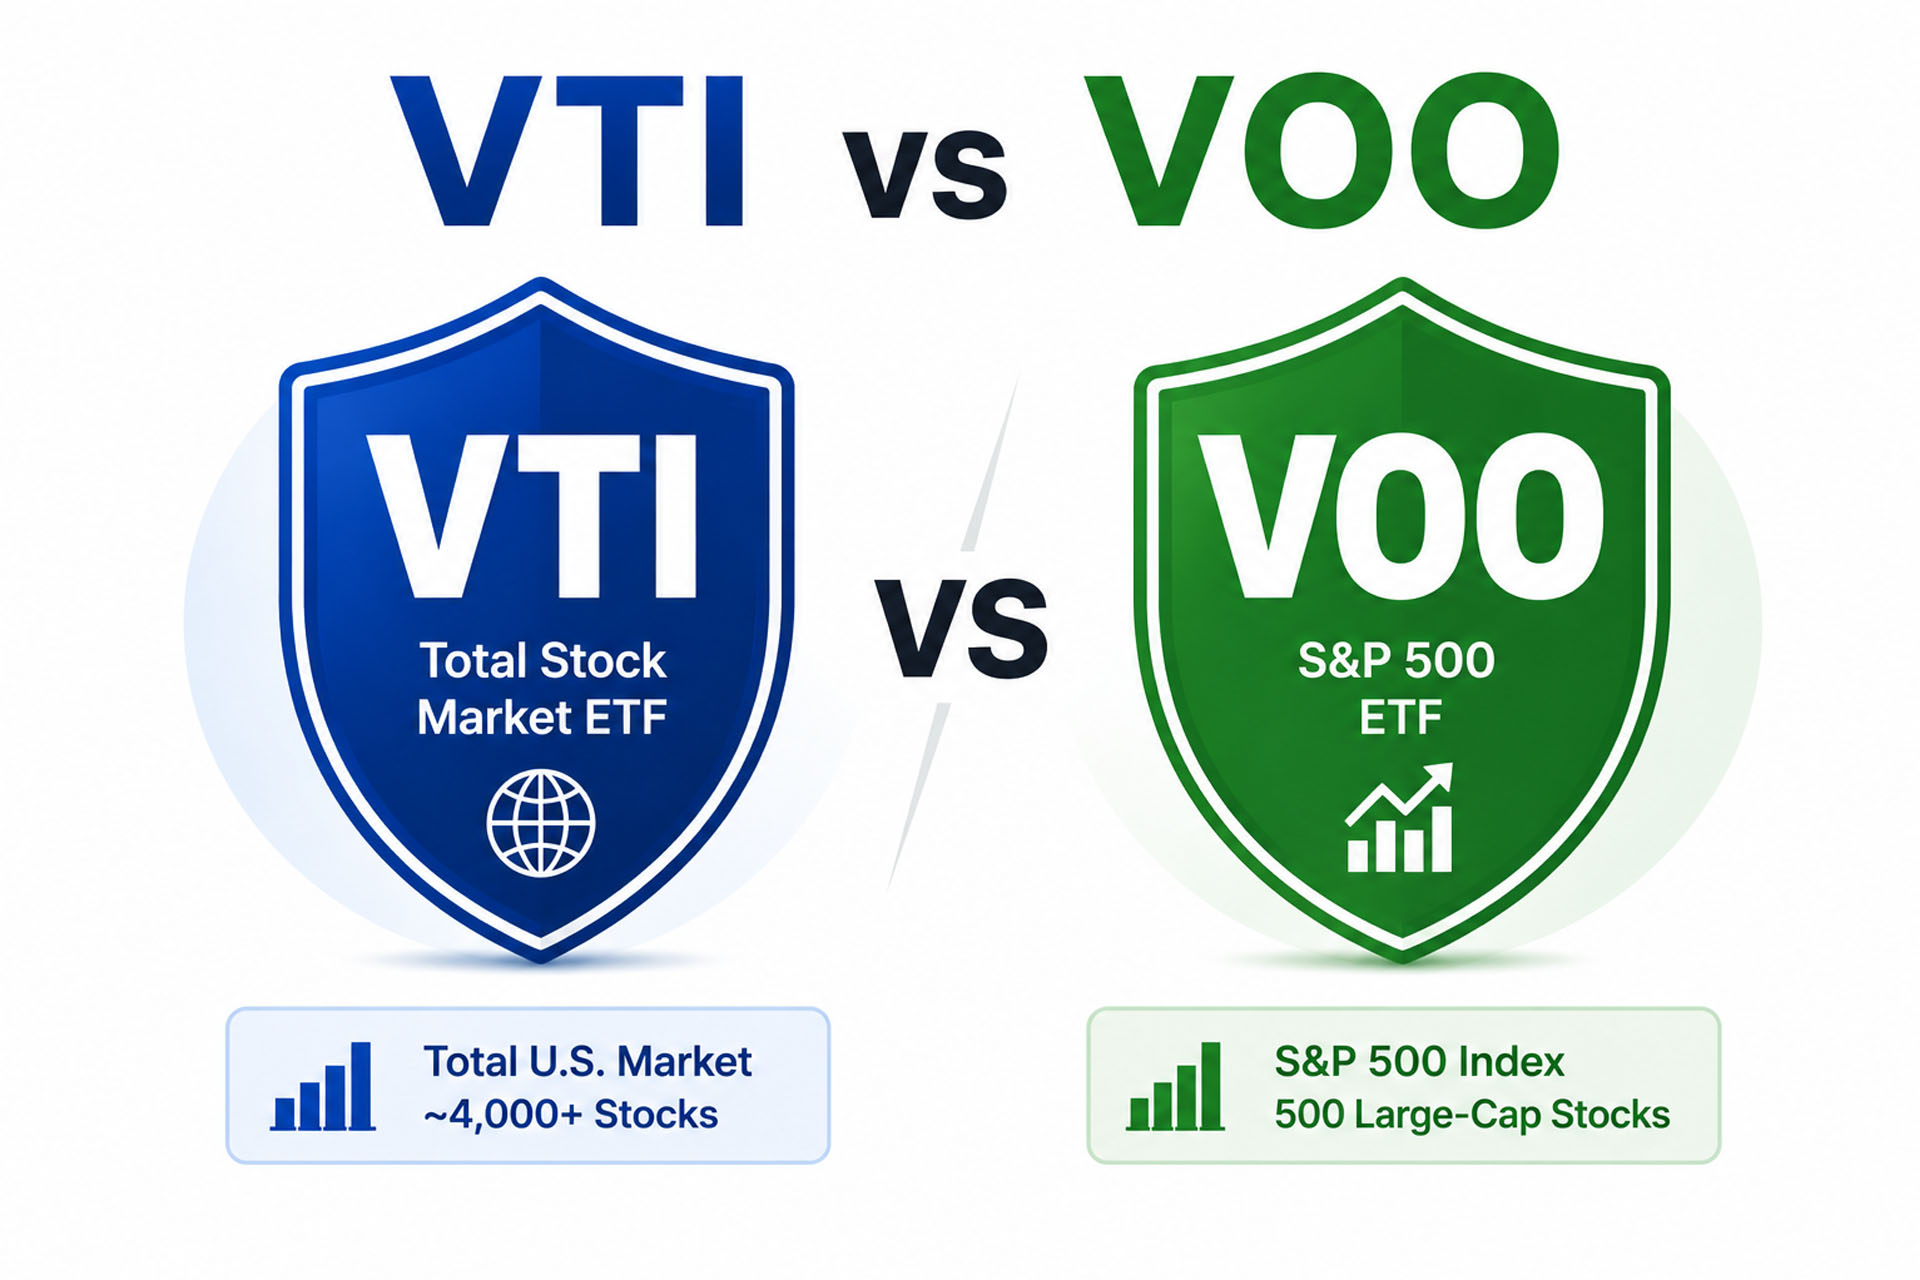
- VOO tracks the S&P 500 (≈500 large-cap stocks), while VTI covers the entire U.S. market (~3,500+ stocks including mid- and small-caps).
- For most buy-and-hold investors, either ETF is an excellent core holding — the bigger risk is staying on the sidelines debating rather than investing consistently.
What Is VOO? The S&P 500 Core
VOO, the Vanguard S&P 500 ETF, was established in 2010 and tracks the famous S&P 500 Index — America’s 500 largest publicly traded companies. As of early June 2026, VOO trades around $676–$678 per share, carries an AUM of approximately $860 billion (ETF share class alone), and its broader fund family totals around $1.5 trillion.
The S&P 500 is committee-selected, meaning a panel evaluates qualitative factors like sector representation in addition to pure market cap. This gives VOO a subtle quality screen, which many investors consider a feature. VOO’s top holdings include Apple, Microsoft, NVIDIA, Amazon, and Meta — the mega-cap tech giants driving U.S. market performance.
Because VOO focuses entirely on large-cap stocks, it represents approximately 80% of the total U.S. stock market by value. In other words, even with VOO alone, you already own the vast majority of America’s publicly traded economic output. If you want to understand why VOO is so popular as a portfolio core, check out our in-depth guide to building a VOO ETF core portfolio.
VOO Key Facts (as of June 2026)
| Attribute | VOO |
|---|---|
| Full Name | Vanguard S&P 500 ETF |
| Index Tracked | S&P 500 |
| Inception Year | 2010 |
| Holdings | ~504 stocks |
| Expense Ratio | 0.03% |
| Approximate Price | ~$676–$678 |
| Dividend Yield | ~1.1–1.4% |
| AUM (ETF Share Class) | ~$860B |
| Market Cap Focus | Large-cap only |
What Is VTI? Total U.S. Market Exposure
VTI, the Vanguard Total Stock Market ETF, was established in 2001 and tracks the CRSP US Total Market Index. It holds over 3,500 U.S. stocks across all cap sizes — large, mid, and small. As of 2026, VTI trades near $363 per share, with its broader fund family holding approximately $2 trillion across all share classes, making it one of the largest mutual funds in existence.
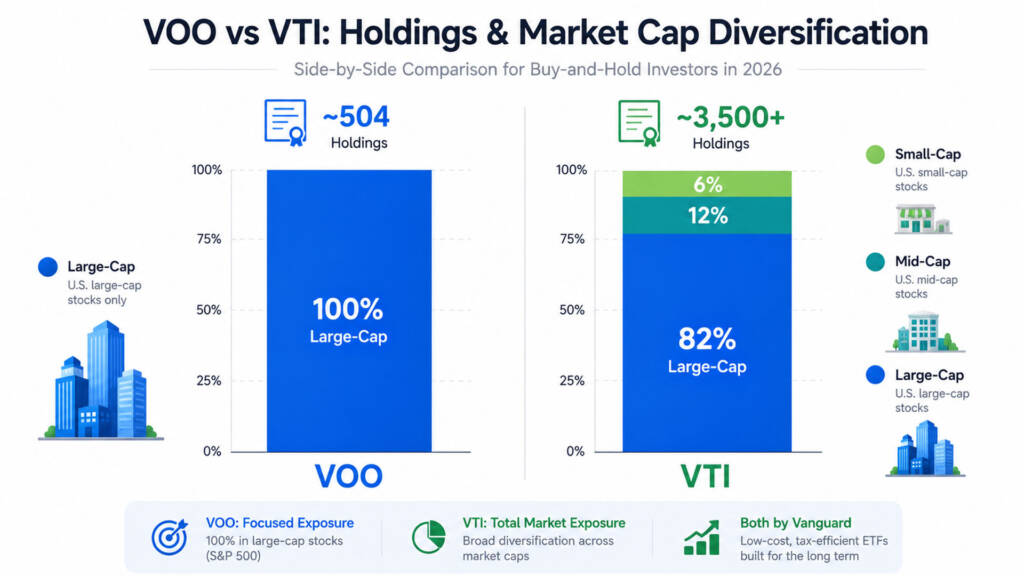
VTI’s composition breaks down roughly as: ~82% large-cap, ~12% mid-cap, and ~6% small-cap. Because the S&P 500 companies already make up roughly 82% of VTI by weight, the two ETFs are highly overlapping. Simply put: VOO is already inside VTI. There is no stock in VOO that is not also in VTI.
The extra ~3,000 smaller stocks in VTI represent the “next generation” of potential market leaders — companies that could grow into large-caps over time — as well as some structural underperformers. For investors who want true, comprehensive U.S. market exposure in a single holding, VTI is the purest vehicle available. To understand the broader ETF landscape, start with our beginner’s guide to what ETF investing is and how it works.
VTI Key Facts (as of June 2026)
| Attribute | VTI |
|---|---|
| Full Name | Vanguard Total Stock Market ETF |
| Index Tracked | CRSP US Total Market |
| Inception Year | 2001 |
| Holdings | ~3,500+ stocks |
| Expense Ratio | 0.03% |
| Approximate Price | ~$363 |
| Dividend Yield | ~1.3% |
| AUM (Total Fund) | ~$2 Trillion |
| Market Cap Focus | Large, mid, and small-cap |
VTI vs VOO: Head-to-Head Comparison
Here is a clean side-by-side breakdown across every key dimension that matters for buy-and-hold investors:
| Feature | VOO | VTI |
|---|---|---|
| Index | S&P 500 | CRSP US Total Market |
| Holdings | ~504 | ~3,500+ |
| Expense Ratio | 0.03% | 0.03% |
| Effective Net Cost (after securities lending) | ~0.03% | ~0.02% |
| Dividend Yield | ~1.1–1.4% | ~1.3% |
| 10-Year Avg Annual Return | ~12.5% | ~12.3% |
| Historical CAGR (long-term) | ~8.54% | ~8.73% |
| Correlation | 99%+ | 99%+ |
| Volatility (Std Dev) | ~19.2% | ~19.5% |
| AUM (ETF Share Class) | ~$860B | ~$570B |
| Best For | Large-cap simplicity, S&P 500 purity | Broader diversification, total market |
The most important takeaway from this table? The practical difference is almost imperceptible. Their 99%+ correlation means they move together in virtually all market environments.
Historical Performance: Which ETF Has Won?
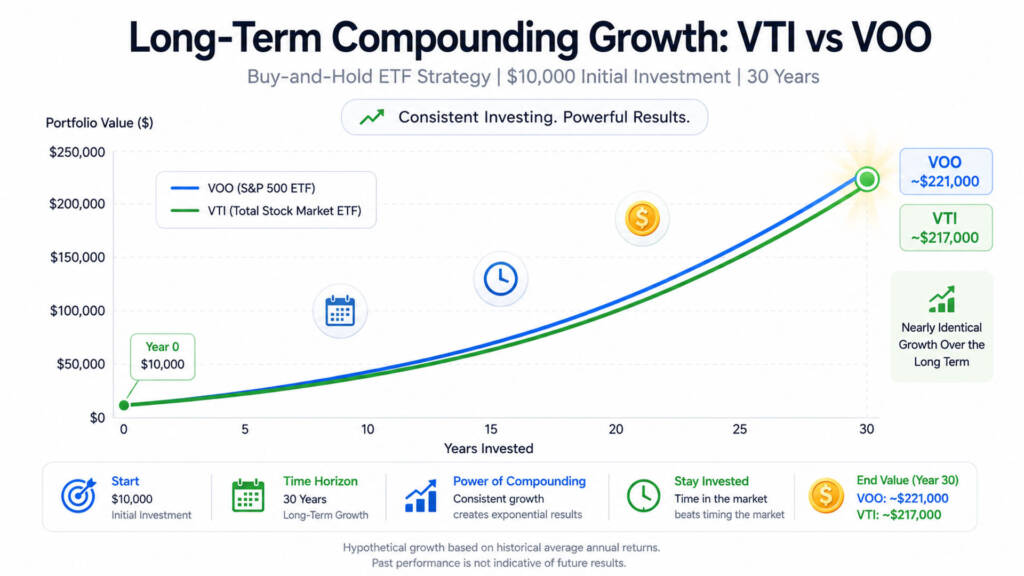
Over the long run, VTI has a slight historical edge. Its mutual fund equivalent (VTSAX) shows a long-term CAGR of approximately 8.73%, compared to VOO’s (VFIAX) 8.54%. A hypothetical $10,000 invested 30 years ago would have grown to approximately $220,000 with VTI versus $210,000 with VOO — a difference of roughly 5% in final value over three decades.
However, the story is more nuanced over shorter horizons. Over the past decade (2016–2025), VOO outperformed VTI by about 0.4% annually, because the mega-cap tech names at the top of the S&P 500 — NVIDIA, Apple, Microsoft, Amazon, Meta — had an extraordinary run. The small and mid-cap stocks that make VTI broader simply couldn’t keep pace with that AI and tech-driven bull market.
In early 2026, however, early data suggests a potential reversal. Small- and mid-cap stocks — the ones VTI holds that VOO doesn’t — are projected to grow earnings by approximately 19%, outpacing the S&P 500’s expected 14.8% earnings growth. Furthermore, small and mid-cap stocks are currently trading at a 25–40% historical valuation discount compared to large caps, creating a compelling potential catch-up argument for VTI. This dynamic is worth watching closely, though neither outcome is guaranteed.
A $500/Month Simulation (Historical ~10% Return)
To make this tangible, let’s simulate investing $500 per month using historical average returns:
| Timeframe | VOO (~10.7%) | VTI (~10.9%) | Difference |
|---|---|---|---|
| 10 Years | ~$103,500 | ~$105,100 | ~$1,600 |
| 20 Years | ~$380,000 | ~$388,000 | ~$8,000 |
| 30 Years | ~$1,130,000 | ~$1,160,000 | ~$30,000 |
These are illustrative projections based on historical average annual returns and do not guarantee future results.
The difference over 30 years is real — but it’s modest. What matters far more than choosing between these two ETFs is starting early and investing consistently. This is the core principle behind dollar-cost averaging, which removes the emotional bias from your investment timing.
Fees, Costs, and the Hidden Advantage of VTI
Both ETFs carry the same 0.03% expense ratio — one of the lowest in the industry. But there is a subtle cost difference that most comparisons overlook: securities lending income.
Both funds lend their holdings to short sellers and institutional borrowers in exchange for fees that flow back to shareholders. Because VTI holds thousands of hard-to-borrow small and mid-cap stocks, it earns significantly more lending income. In fiscal year 2025, VTI earned approximately $194 million in net securities lending income versus just $10 million for VOO. On a per-asset basis, this drops VTI’s effective net cost to approximately 0.02%, while VOO’s remains at the stated 0.03%.
This is a very small difference in practical terms — but it is real, and it consistently favors VTI. Over decades of compounding, even fractional fee differences add up. If you’re thinking about whether to combine ETFs like VOO with income-generating strategies, our VOO and JEPQ portfolio guide walks through a practical approach.
Dividends: Nearly Identical Yields
Both ETFs distribute quarterly dividends, and their yields are virtually identical. VOO currently yields approximately 1.1–1.4%, while VTI yields around 1.3%. The difference is negligible for income-focused investors.
There is one minor tax distinction: VOO produces essentially 100% qualified dividends because it holds only large-cap domestic stocks. VTI produces approximately 95% qualified dividends, with the remaining ~5% coming from REIT holdings and certain small-cap stocks. For most investors at standard tax brackets, the after-tax difference on a $100,000 position is roughly $13 per year — truly inconsequential. If passive income through dividends is your primary motivation, you might want to explore dedicated income ETFs as well. Our comparison of SCHD vs DGRO is a great next read.
Tax Efficiency: A Draw
Both VOO and VTI are among the most tax-efficient ETFs available. Remarkably, VOO has never distributed a capital gain since its 2010 inception, and VTI has never distributed a capital gain since its 2001 inception. This is made possible by Vanguard’s unique dual share-class structure, where in-kind redemptions allow the funds to purge low-cost-basis securities without triggering taxable events for remaining shareholders.
One advanced strategy worth knowing: VOO and VTI make excellent tax-loss harvesting partners. Because they track different indexes (S&P Dow Jones vs. CRSP) and hold materially different numbers of securities, they are not considered “substantially identical” under the IRS wash sale rule. This means you can sell one at a loss, immediately buy the other to maintain market exposure, and still claim the tax deduction — a powerful move in a down market. For more on weathering volatility strategically, see our guide on what to do when the stock market crashes.
Who Should Choose VOO?
VOO is the better choice if any of the following describe you:
- You want simplicity and brand recognition. The S&P 500 is the world’s most-tracked index and is widely understood.
- You already have small-cap exposure elsewhere in your portfolio — perhaps through a dedicated small-cap value fund or international ETF.
- You prefer the Warren Buffett stamp of approval. Buffett has famously recommended the S&P 500 index for most individual investors.
- You want the single largest ETF in the world for maximum liquidity and tight bid-ask spreads. VOO crossed $860 billion in AUM in 2025.
- You’re building a core-and-satellite portfolio with VOO as the stable anchor — a strategy we explore in our core-and-satellite portfolio guide.
Who Should Choose VTI?
VTI is the better choice if these factors resonate with you:
- You want true total U.S. market coverage in a single fund, including every mid and small-cap company.
- This is your only U.S. stock holding. VTI ensures no domestic company is excluded by default.
- You believe in the small-cap valuation opportunity in 2026. With small and mid-caps at a 25–40% discount to large-caps, VTI offers exposure to potential mean reversion.
- You prefer a rules-based, purely passive index (CRSP) rather than a committee-selected one (S&P 500).
- You’re building a classic three-fund Bogleheads portfolio: VTI + VXUS (international) + BND (bonds) — a powerful, low-cost strategy many long-term investors swear by.
If you’re comparing VOO against other ETFs more broadly, our QQQ vs VOO and VOO vs SPY 2026 guides give you the full picture of the major S&P 500 contenders.
Can You Hold Both VTI and VOO?
Technically, yes — but it adds almost no value. Since VOO is already approximately 82% of VTI by weight, holding both ETFs creates significant overlap and portfolio redundancy without meaningful diversification benefit. You would essentially be double-weighting the same large-cap stocks.
If you want to build a multi-ETF portfolio, a more effective approach is pairing VOO or VTI with complementary asset classes — such as international equities (VXUS), dividend ETFs (SCHD), or bond ETFs. Our 3-ETF portfolio strategy guide shows you exactly how to build a balanced, globally diversified portfolio using just three funds. For those interested in combining VOO with income-generating ETFs, explore our passive income ETF portfolio framework.
VTI vs VOO: The Verdict for Buy-and-Hold Investors
Here is the honest bottom line: both VTI and VOO are exceptional long-term investments, and the choice between them will not make or break your financial future. Their 99%+ correlation means they deliver essentially the same experience through every market cycle.
- Choose VOO for S&P 500 simplicity, the world’s most recognized index, and rock-solid large-cap stability as a core portfolio anchor.
- Choose VTI for the broadest possible U.S. diversification, a marginally lower effective cost (0.02% vs. 0.03%), and exposure to potential small-cap upside.
- Most importantly: pick one and invest consistently. The real wealth-destroyer is not choosing the “wrong” ETF — it’s staying in cash while waiting for perfection.
Ready to start investing in VOO or VTI with low commissions? You can open a brokerage account at Interactive Brokers, one of the most cost-effective platforms for international and U.S. investors alike. For additional research, Vanguard’s official fund pages and Investopedia’s ETF education center are excellent authoritative resources.
Conclusion & Call to Action
The VTI vs VOO debate is one of the most searched topics in passive investing — and for good reason. Both ETFs represent the gold standard of low-cost, diversified U.S. equity investing. VOO gives you the world’s most-followed index in its purest form, while VTI extends that coverage to capture the full breadth of the American economy.
The decision is less important than the commitment. Whether you start investing $50, $500, or $5,000 a month into either fund, the power of compounding over 20–30 years is transformative. For inspiration on starting small, see our guide on investing $50 a month in VOO.
What’s your move — VTI or VOO? Leave a comment below and tell us which ETF you’re holding and why. And if you found this guide helpful, check out our comparison of VOO vs SPY in 2026 for a deeper dive into how the top S&P 500 ETFs truly stack up.
FAQs
Q1: Is VTI better than VOO for long-term buy-and-hold investing?A1: Historically, VTI has a marginally higher long-term CAGR (~8.73%) compared to VOO (~8.54%) due to its small- and mid-cap exposure. However, the two ETFs have a 99%+ correlation and perform nearly identically over most time periods. For buy-and-hold investors, either is an excellent choice — the more important factor is consistency of contributions and staying invested through market downturns.
Q2: What is the main difference between VTI and VOO?A2: The primary difference is scope. VOO tracks the S&P 500 and holds approximately 504 large-cap U.S. stocks. VTI tracks the CRSP US Total Market Index and holds over 3,500 stocks across all market capitalizations — large, mid, and small. Since VOO makes up approximately 82% of VTI by weight, they are highly overlapping. VTI simply adds roughly 3,000 additional smaller companies.
Q3: Can a beginner investor start with just VTI or VOO and nothing else?A3: Absolutely. Either VTI or VOO alone is a completely legitimate, well-diversified U.S. equity portfolio for a beginner. Both ETFs give you instant exposure to hundreds (or thousands) of companies, professional market-cap weighting, and Vanguard’s industry-leading cost structure — all for just 0.03% per year. The key is to start early, invest regularly, and avoid panic-selling during downturns. For more foundational guidance, read our article on common beginner investor mistakes to avoid.
Financial Disclaimer: This article is for educational and informational purposes only and does not constitute financial, investment, or tax advice. All data, projections, and simulations referenced herein are based on historical performance and publicly available information as of June 2026. Past performance does not guarantee future results. Investing in ETFs and securities involves risk, including the potential loss of principal. Individual financial situations vary. Always conduct your own due diligence and consult a licensed financial advisor before making any investment decisions.